

Author: Rebekah Stovall
Weekly Energy Update (April 1, 2021)
by Bill O’Grady, Thomas Wash, and Patrick Fearon-Hernandez, CFA | PDF
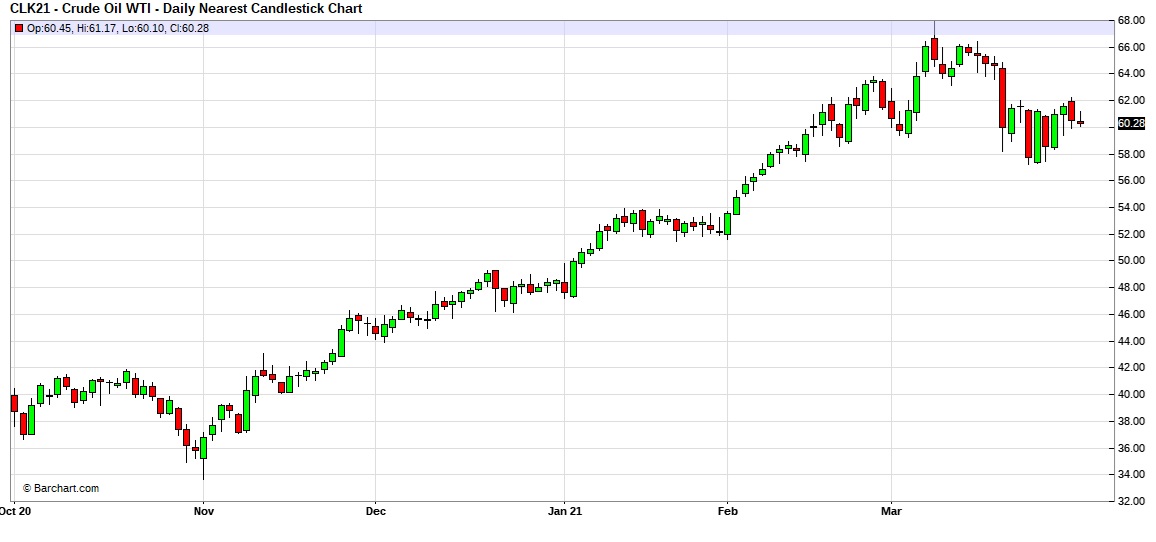
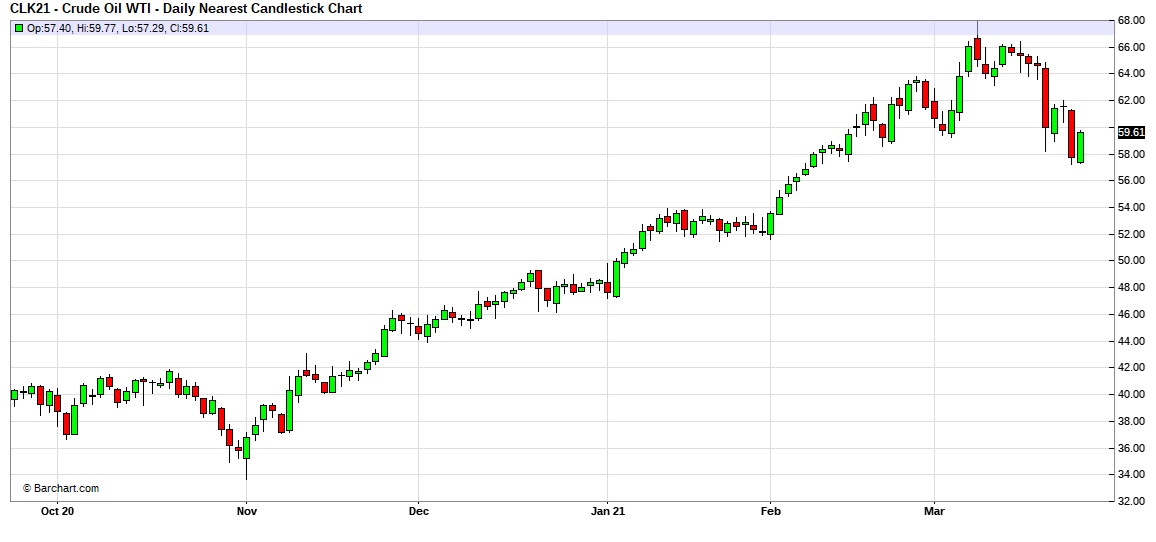
After peaking in early March, prices have pulled back to pivot around $60 per barrel. Although recent builds in crude oil are bearish, expectations for stronger economic growth should be supportive for prices.
Crude oil inventories fell 0.9 mb compared to the 1.7 mb draw expected. There was no change in the SPR. Refinery operations have normalized to pre-Texas freeze levels.
In the details, U.S. crude oil production rose 0.1 mbpd to 11.1 mbpd. Exports rose 0.7 mbpd, while imports rose 0.5 mbpd. Refining activity rose 2.3%.
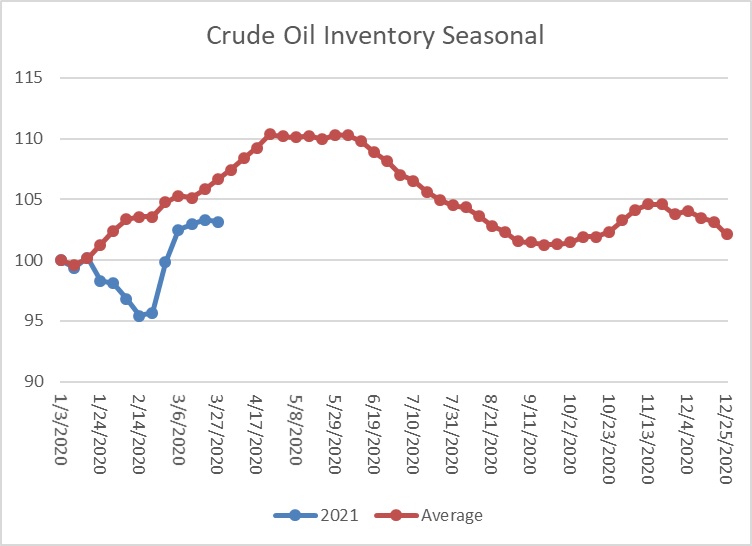
This chart shows the seasonal pattern for crude oil inventories. We are well into the winter/early spring build season. Until the Texas freeze, we were seeing a counterseasonal decline. This week, stockpiles declined modestly but usually don’t this time of year. We are currently at a seasonal deficit of 21.5 mb.
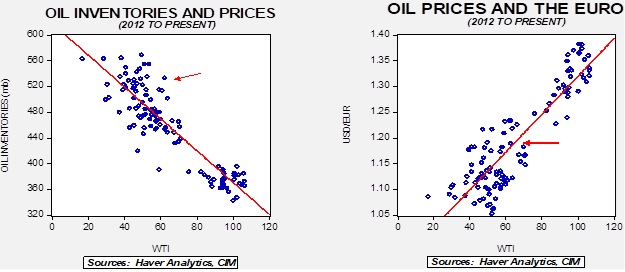
Based on our oil inventory/price model, fair value is $40.53; using the euro/price model, fair value is $64.67. The combined model, a broader analysis of the oil price, generates a fair value of $51.04. The divergence continues between the EUR and oil inventory models, although recent dollar strength has reduced the projected fair value generated from the euro/price model.
Market news:
- Abu Dhabi is unveiling a new futures contract based on its oil. If the contract becomes popular, it will put a market price on OPEC oil and could undermine efforts by the cartel to control the price of OPEC crude, especially from the Middle East.
- As vaccination efforts expand and the U.S. economy reopens, driving should rise which is bullish for corn.
Geopolitical news:
- The eventual transition to transportation electrification will dramatically reduce oil prices and revenues to oil producers. This development will likely have significant negative effects on oil-producing nations which are dependent on oil revenues. This is especially the case for less developed nations that produce oil; often, their marginal costs are high which means their oil will be the first to be priced out of the market.
- China and Iran have inked a deal for investment and security. Although we don’t expect Chinese warships and military to be engaged anytime soon, the pact will undermine U.S. efforts to force Iran to negotiate over its nuclear program and other issues.
- An Islamist insurgency is threatening a natural gas project in Mozambique.
- NGOs are calling on Chevron (CVX, USD, 105.03) to halt payments to Myanmar for projects the company has in the country. Myanmar recently had a coup and protests against the military have become increasingly violent.
- The Canadian Supreme Court has upheld the government’s carbon tax.
Alternative energy/policy news:
- The Biden administration is unveiling an infrastructure package with “green” tones to it. Proposals for greening the economy through public investment have been around for a while; it remains to be seen if this attempt will be more successful.
- As we have noted earlier, the government is considering various subsidies to farmers to compensate them for farming practices that capture and store carbon dioxide. However, to date, no concrete proposals have emerged.
- April Fool’s! Sources indicated that the U.S. division of Volkswagen (VOW, EUR, 307.20) was planning to change its name to “Voltswagen” to reflect the move to electrification. Turns out it was an April Fool’s joke a few days early.
- We continue to watch the rapid innovations in battery technology. The most recent changes are tied to lithium. It is well known that a pure lithium battery would be much more efficient, allowing for larger batteries, faster charges, and would last longer. One small problem is that lithium in its pure form is reactive and explodes when exposed to liquid. However, there are reports indicating that creating a liquid electrolyte eliminates the problem and ends the need for a solid-state battery. If this works, it would potentially revolutionize batteries and accelerate the transition.
- As we have discussed previously, hydrogen-powered fuel cells are a potential alternative to batteries. It may end up that hydrogen is more appropriate for fleets (where centralized fueling could take place) and aircraft (where batteries may weigh too much). Railroads in California are testing fuel cell locomotives.
- Wind power has been in place in the U.S. for some time, but it remains problematic. The windmills have been known to harm bird populations. Less populated areas tend to have the most persistent winds, but then require long transmission lines to deliver the “juice.” The long lines can be unpopular. The process of siting turbines can also be problematic as they are “hard to miss” once constructed. These issues have led to turbines being placed offshore, just over the horizon, to avoid these issues. In addition, winds tend to be very persistent offshore. Although such facilities are more common in Europe, the Biden administration is looking to construct them here in the U.S. as well.
- Soon after the election, the new administration suspended oil and gas leases on federal lands. It was unclear if this was a temporary measure or one destined to be permanent (or until a new government takes power). So far, the measures remain in place, but an outright ban hasn’t been announced either.
- A court in France recently declared that the government is responsible for climate mitigation. Although it is unclear how this decision will affect policy, protests against perceived government inaction have emerged recently.
- Congress has introduced new fees for methane emissions. Often, methane is released as part of the drilling process for oil and natural gas. In fact, recently, as drilling activity has accelerated, there has been a consequent increase in methane releases. Methane is a potent greenhouse gas and the fees are designed to reduce these emissions.
- Japan has been supporting coal-fired electricity plants across Asia. It has decided to end the practice, which would be a blow for coal demand.
- The American Petroleum Institute, the primary industry lobbyist, has decided to support carbon pricing. This decision suggests it sees carbon pricing as the most effective tool for carbon emissions management as opposed to cap and trade or regulatory restrictions. Now the issue will be the price applied.
View PDF
Weekly Geopolitical Report – The Geopolitics of Central Bank Digital Currencies (CBDC): Part III (March 29, 2021)
by Bill O’Grady | PDF
(Due to the Easter holiday, the next report will be published on April 12.)
This week, we continue our series with an examination of the geopolitics of CBDC.
The Geopolitics
As we noted in Part I, there has been strong interest among the central banks to introduce digital currencies. We would expect each country that decides to establish a CBDC regime will do so based on its domestic situation. But these new currencies won’t exist in a vacuum; the establishment of CBDC in one country will likely affect what occurs in other nations as well.
Therefore, this week’s report examines the likely structure of CBDC in the U.S., China, and the Eurozone. We will project what a CBDC will look like in each region by establishing the priorities of each one, a likely CBDC structure based on those priorities, and current progress. Obviously, the world is more than these three entities, but for our purposes, the introduction of CBDC by these three powers will tend to determine what other nations decide on this issue.
Asset Allocation Weekly – #33 (Posted 3/26/21)
Asset Allocation Weekly (March 26, 2021)
by Asset Allocation Committee | PDF
(Note: Due to the upcoming Good Friday holiday, the next report will be published on April 9.)
Since peaking in August, gold prices have been under pressure.
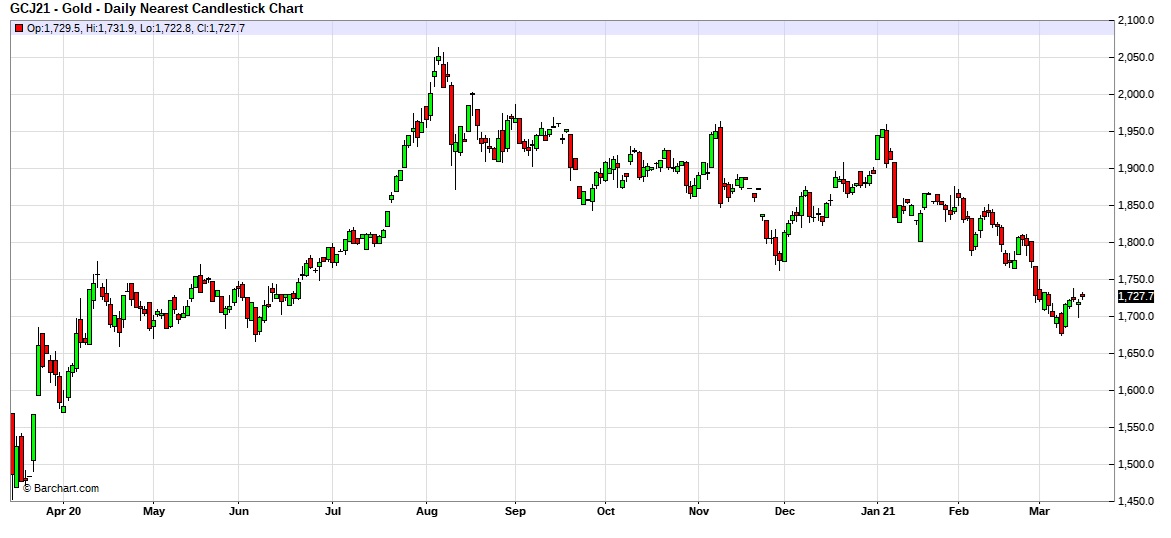
Technically, prices broke support around 1750 in early March and have been attempting to consolidate.
We have been holding gold in our asset allocation portfolios since 2018, although the level was reduced in the most recent rebalance to add a position in broader commodities. As the price languishes, how should investors view gold? What is the outlook?
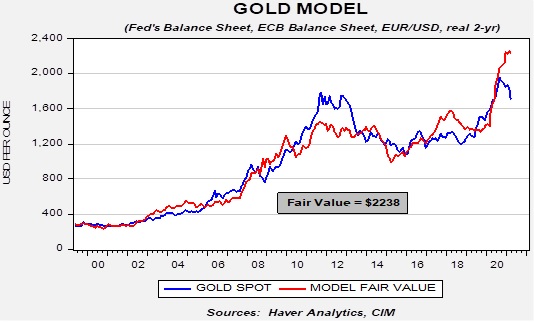
The long-term outlook for gold remains positive. Our basic gold model, which uses the balance sheets of the Federal Reserve and the European Central Bank, the EUR/USD exchange rate, and real two-year T-note yields, suggests that prices are significantly undervalued.
On the other hand, there are several short-term factors that are weighing on prices. The most important is rising long-duration Treasury yields.
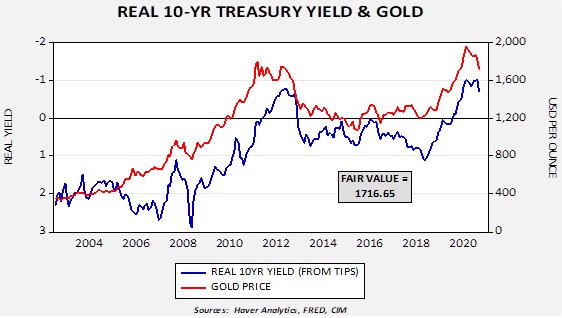
This chart shows the real 10-year yield derived from the TIPS spread against Treasuries. The real yield is inverted on the chart scale. Note that recently the real yield began to rise (become less negative). Regressing the relationship generates a fair value of 1716.65, which is around where gold is trading now. In addition, we have seen gold flows into exchange-traded products wane recently, adding additional pressure.
If the FOMC is serious about boosting employment, monetary policy should remain accommodative; the problem for policymakers is that a steepening yield curve will tend to lift long-term interest rates further. If the Fed allows the 10-year T-note to “find its natural level,” then we would expect rates to reach 1.90% to 2.00%. That likely means additional short-term pressure on gold prices. At some point, we do expect the FOMC to take steps to halt the rise in long-term Treasury rates which will likely lift gold prices. But, until that happens, gold will likely struggle to rally.
Business Cycle Report (March 25, 2021)
by Thomas Wash | PDF
The business cycle has a major impact on financial markets; recessions usually accompany bear markets in equities. The intention of this report is to keep our readers apprised of the potential for recession, updated on a monthly basis. Although it isn’t the final word on our views about recession, it is part of our process in signaling the potential for a downturn.
In February, the diffusion index rose further above the recession indicator, signaling that the recovery is continuing. Another round of fiscal stimulus elevated equities but led to a modest sell-off in Treasuries. Meanwhile, a slowdown in COVID-19 cases and easing restrictions made it easier to hire workers, thus last month saw an improvement in labor market conditions. However, poor weather conditions and supply constraints, particularly lack of semiconductors and lumber, led to a pullback in manufacturing and construction activity. As a result, four out of the 11 indicators are in contraction territory. The reading for February was unchanged from the previous month at +0.2727, above the recession signal of +0.2500.
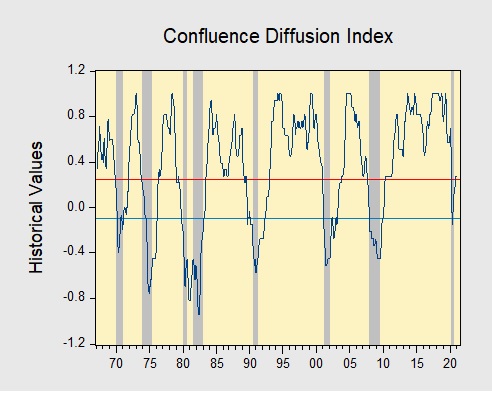
The chart above shows the Confluence Diffusion Index. It uses a three-month moving average of 11 leading indicators to track the state of the business cycle. The red line signals when the business cycle is headed toward a contraction, while the blue line signals when the business cycle is headed toward a recovery. On average, the diffusion index is currently providing about six months of lead time for a contraction and five months of lead time for a recovery. Continue reading for a more in-depth understanding of how the indicators are performing and refer to our Glossary of Charts at the back of this report for a description of each chart and what it measures. A chart title listed in red indicates that indicator is signaling recession.
Weekly Energy Update (March 25, 2021)
by Bill O’Grady, Thomas Wash, and Patrick Fearon-Hernandez, CFA | PDF
Here is an updated crude oil price chart. Prices have declined over $10 per barrel since peaking on March 8. Worries about slowing European growth and a slower than expected recovery in refinery operations after the Texas freeze have weighed on prices.
Crude oil inventories rose 1.9 mb compared to the 1.2 mb expected. There was no change in the SPR. Refinery operations, as noted below, continue to recover.
In the details, U.S. crude oil production rose 0.1 mbpd to 11.0 mbpd, meaning that U.S. production has recovered to pre-Texas disruption levels. Exports were unchanged, while imports rose 0.3 mbpd. Refining activity rose 5.5%.
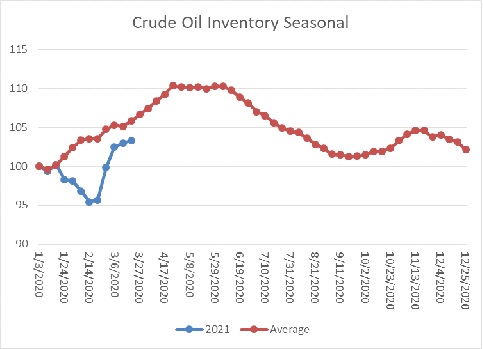
The above chart shows the annual seasonal pattern for crude oil inventories. Inventories remain at a seasonal deficit, but the gap did narrow, mostly due to disruptions surrounding the recent cold snap. If we were following the normal seasonal pattern, oil inventories would be 17.1 mb higher.
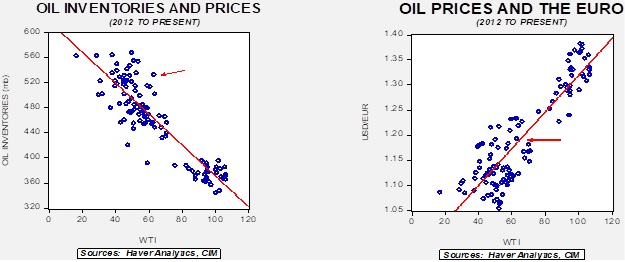
Based on our oil inventory/price model, fair value is $40.25; using the euro/price model, fair value is $65.54. The combined model, a broader analysis of the oil price, generates a fair value of $51.37. The divergence continues between the EUR and oil inventory models, although recent dollar strength has reduced the projected fair value generated from the euro/price model.
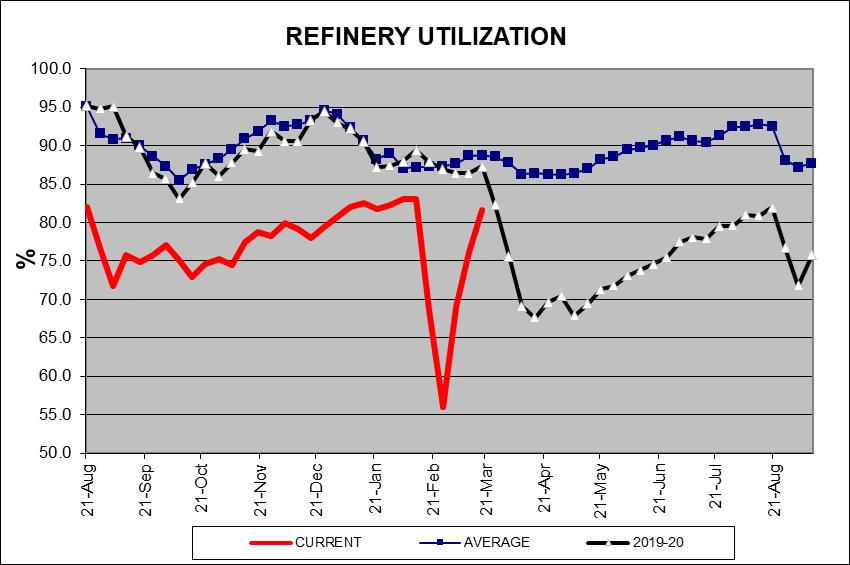
Refinery operations continued to recover last week and are near pre-winter storm levels. We would expect utilization to stabilize in the coming weeks.
Market news:
- Oil prices rallied after a large container ship blocked the Suez Canal. More than 100 ships are backed up at this critical shipping chokepoint. About 10% of world shipping traffic passes through the canal. The vessel ran aground in a sandstorm, which not only blocked visibility but made steering the ship difficult.
- Canadian Pacific Railway (CP, USD, 355.82) has agreed to buy Kansas City Southern (KSU, USD, 248.96) railroad. The concept behind the merger (which still needs regulatory approval) is to create a rail line from Mexico to Canada, effectively consolidating the USMCA trading bloc. A side effect of this merger could be that it allows Canadian tar sands oil to have another outlet to the U.S. via rail shipping. Pipelines have become increasingly difficult to build due to environmental regulations; we will be watching to see if these same groups try to block the merger.
- Companies that are considered risky credits have been able to issue new debt. This factor should reduce bankruptcies in the system and help maintain production. Although companies have been promising better output discipline, the combination of strong prices and available credit may lead to higher output.
- Despite banks making pledges to support the greening of the economy, they continue to make loans to fossil fuel companies. Globally, loans of $750 billion were made last year.
- The impact of the Texas freeze is slowly dissipating, but we are still seeing a notable impact on petrochemical markets.
- Saudi Aramco (2222, SAR, 34.90) announced it would maintain its dividend despite falling oil prices. The company had to borrow to meet this dividend. This factor suggests that the House of Saud continues to use the company as a source of funding and is not allowing it to act as a fully private, profit-seeking entity.
- As the U.S. increases vaccinations, we would expect that gasoline demand will continue to recover. Rising consumption, coupled with a slowly recovering refining sector, will likely lead to higher gasoline prices. This rise will likely be a political issue for the current administration. However, we do note that driving activity remains historically low, not just on a cyclical basis, but on a secular basis as well.
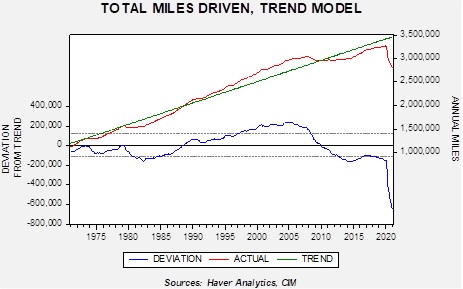
Driving activity fell below trend during the Great Financial Crisis and plummeted during the pandemic. It is highly unlikely we will ever return to trend. This factor will tend to dampen either gasoline prices or force the refining industry to contract. Recent IEA research supports this notion.
- The SEC is forcing energy companies to entertain investor votes on emissions targets. This factor will complicate company management.
Geopolitical news:
- A Biden administration goal was to return to the Obama-era nuclear deal. However, very little progress has been made. Iran wants the U.S. to roll back sanctions as a precondition for talks, while the U.S. wants Iran to cut back on nuclear activities as a precondition for talks. Given the history, neither side trusts the other. A complicating factor is that some parts of the 2015 agreement are coming to their negotiated end, meaning the return to the original deal doesn’t do much to address Iran’s threat to the region. Our take is that Obama wanted Iran to become the regional hegemon, allowing the U.S. to then shift its focus to Asia. Naturally, Israel and the Gulf States opposed this idea. However, the nuclear deal was a small step in the process; Obama likely accepted this because he assumed a Democrat would succeed him and carry out the rest of the process. This obviously didn’t occur. Now, the Biden administration likely has the same goal―exiting the Middle East―but doesn’t have an obvious path to that end.
-
- Despite this problem, left-wing populists (LWP) are getting agitated with the lack of progress. The LWP is concerned about the humanitarian impact of U.S. sanctions and wants to see this situation resolved.
- Iranian presidential elections will be held in June; the U.S. insists this isn’t a factor, but we fail to see how it wouldn’t affect negotiations.
- It is clear that sanctions have severely harmed the Iranian economy but have done little to move its leadership to talks. The longer sanctions are in place, the better Iran gets at undermining them.
- The Saudis have offered a ceasefire to Houthi rebels and a lifting of the blockade in a bid to start talks. So far, there has been little movement to end the conflict despite these offers.
- China is expanding its refining industry in a bid to dominate Asian product trade. This decision flies in the face of “greening” energy.
Alternative energy/policy news:
- An interesting area of battery research is in creating “massless” batteries. This isn’t a battery that has no mass but one that is part of the structure of the product. For example, if one could put the battery into the frame of a car, the battery would no longer be dead weight. Researchers claim they are making progress in this area; if true, it would open up new options for transportation, e.g., battery aircraft.
- India is considering a 2050 net-zero carbon goal. Given its current heavy use of coal for electricity, if met, it would be more negative news for coal. We note it would be a decade before China has promised to reach this level.
- Global oil company leaders are supporting a plan for pricing carbon. Without a carbon price, it will be difficult to use the market to allocate toward cleaner energy.
- After languishing for years, uranium prices are rising, boosting the prospects for uranium miners. If modular nuclear reactors become popular, the outlook would be even brighter.
View PDF
Weekly Geopolitical Report – The Geopolitics of Central Bank Digital Currencies (CBDC): Part II (March 22, 2021)
by Bill O’Grady | PDF
In Part I, we discussed the metaphysics of money. This week, we will examine the current structure of money and the potentially complicated impact of CBDC.
The Current Structure
Here is a Venn diagram of the current structure of money in most developed markets.
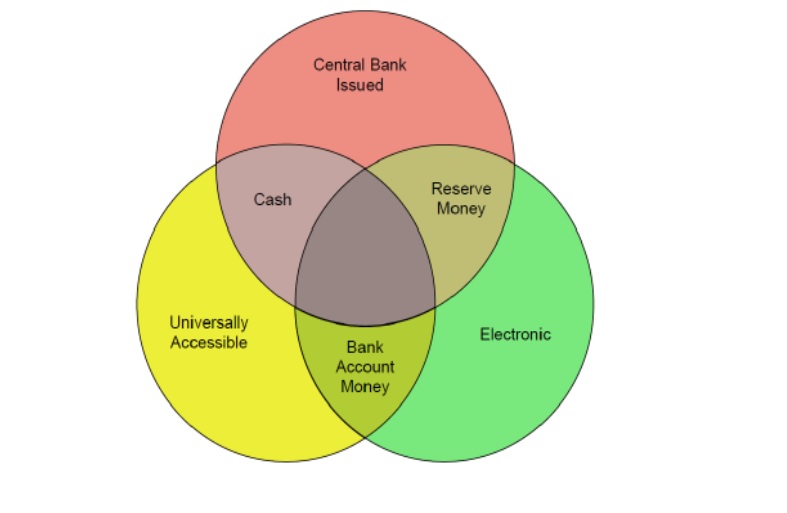
First, there are two forms of money that are electronic only—reserve money and bank account money. Reserve money is part of the monetary base and it is money that banks “hold” at the central bank. Only banks can access reserve money, or, put another way, only banks have direct access to the balance sheet of the central bank.
Bank account money is money held in household or firm bank accounts. It is mostly created by banks through the lending process. The central bank issues two forms of money—cash, which is an anonymous bearer instrument, and reserve money. Finally, cash and bank account money are held by anyone, therefore they are universally accessible.