by the Asset Allocation Committee | PDF
- The economic recovery is still in the early stages and we maintain that the expected path will be long and slow moving.
- The Federal Reserve, along with other global central banks, will likely continue to be aggressively accommodative.
- Another round of fiscal stimulus is expected, which should be positive for equities.
- With the backdrop of an accommodative Fed and a low rate environment over the three-year forecast period, the weighting to equities is increased.
- The prior emphasis on cyclical equities is augmented by a tilt to value over growth.
- The prospect of a waning U.S. dollar in combination with a global economic recovery encourages an increased allocation to non-U.S. equities.
- Exposure to precious metals is retained, though a portion was repositioned to a broader basket of commodities given the advantages they confer during an economic recovery.
ECONOMIC VIEWPOINTS
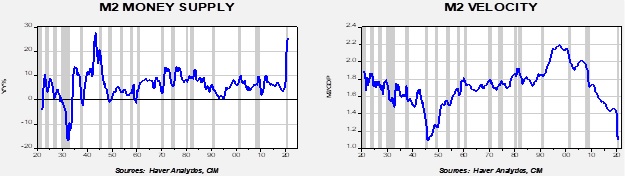
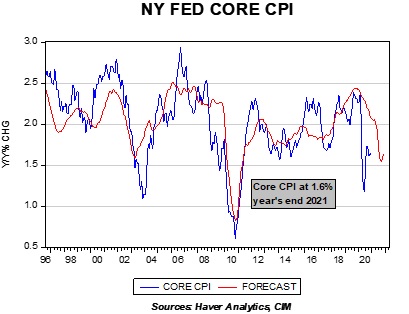
The aggressively accommodative monetary policy of the Fed combined with the potential for a healthy round of further fiscal stimulus creates a favorable backdrop for risk assets, in our view. Although many believe that such policies make for a potential inflationary environment, and while we acknowledge that there may be an interlude that contains inflation toward the second half of this year, we find the probability to be low for persistent elevated inflation through our full three-year forecast period. Our expectations are that the ultra-low fed funds rate will continue well through the economic recovery and even into an expansion. In addition, we believe that the potential for the Fed to engage in a form of yield curve control is elevated. However, we think it is unlikely for the Fed to attempt to exert control of rates beyond the 10-year maturity, and consequently long bonds will become the principal reflection of investor risk appetite and inflation expectations.
While many have made the argument that the economic soil is becoming more fertile for inflation, given Fed intransigence, fiscal stimulus, pent-up demand created by the pandemic, and a waning value of the U.S. dollar, we believe there exists a tremendous amount of slack in the economy and that the slow and steady recovery in the U.S. will help to hold inflation in check.
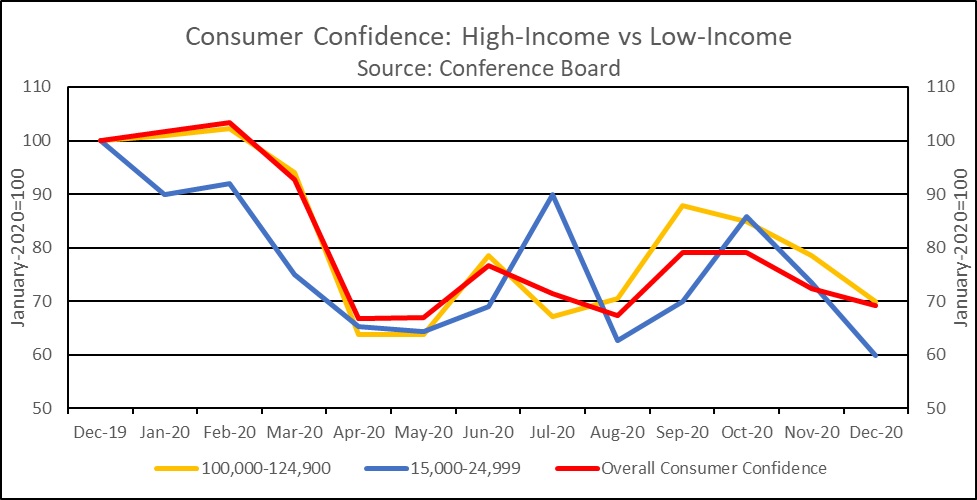
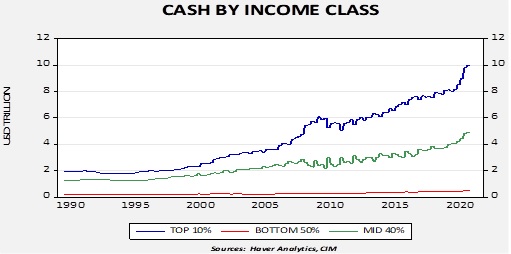
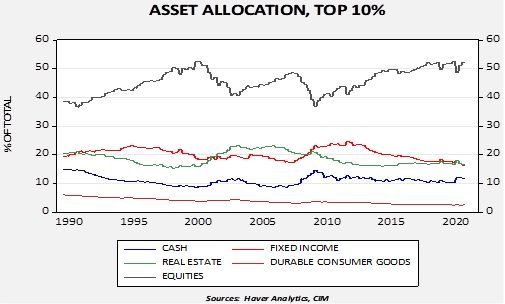
The lack of inflation expectations for goods and services does not, however, extend to financial assets. The backdrop of a docile Fed, a solid, albeit slow, economic recovery, and an abundance of cash among the investor class produces solid prospects for inflation in risk assets, such as investment-grade corporate credit, equities, and industrial commodities. It is difficult to overstate the amount of liquidity that exists among investors. Not only is the nominal amount of retail money market assets near historic highs, but money market assets as a percentage of cash are at historically modest levels as rates are close to zero. Our belief is that investors have been reluctant to put assets to work stemming from concerns about the long-term economic effects of COVID-19 and the uncertain political environment. With a vaccine beginning to be widely distributed, the U.S. election season in the rear-view mirror, and the potential for further fiscal stimulus, we think it probable that cash assets will be put to work in risk assets.
Beyond the U.S., global central banks are following the Fed’s ultra-accommodative monetary policy playbook. The quarterly Bloomberg review of monetary policy indicated there is no major developed economy central bank that is expected to raise rates this year. Moreover, central banks of the larger emerging economies, including Russia, China, Mexico, and India, are expected to cut their benchmark interest rates further. Complementing easy monetary policies is more fiscal stimulus around the globe as countries contend with low inflation and high unemployment. In our view, the outgrowth of these efforts globally will be economic recovery and continuing low inflation.
STOCK MARKET OUTLOOK
As noted above, our expectations for risk assets are positive. The combination of fiscal and monetary stimulus, a recovering economy, low inflation, and an abundance of cash on the sidelines among investors sets an attractive stage for equities over our three-year forecast period. We believe that corporate earnings will recover in the near-term and expand toward the end of our forecast period. A docile inflation environment will help to buoy P/E ratios, thus we expect they will remain elevated.
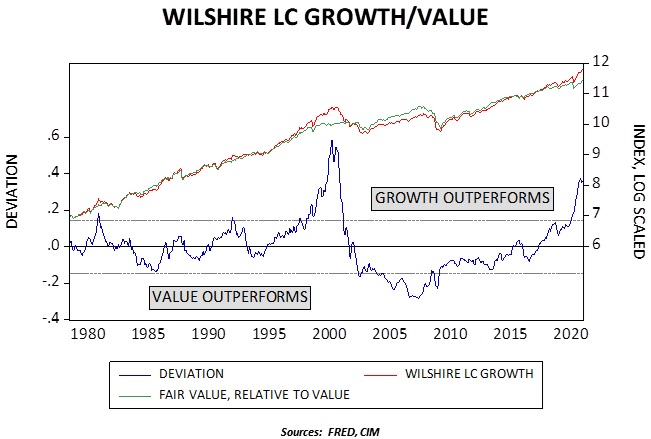
While positive on equities overall, we recognize that all equities will not be treated equally. As the accompanying chart indicates, the disparity between growth and value stocks is close to an historic level. Although such a disparity can persist for an extended period, as it did two decades ago as well as over the past few years, we expect this gap to narrow over the forecast period. This is not to imply that growth stocks will rapidly retrench. The potential exists for companies categorized as growth simply to remain rangebound while value stocks advance. This would be the typical pattern established in the early through mid-stages of an economic recovery. Last quarter, we introduced an emphasis on cyclical stocks through sector overweights of Industrials and Materials and dedicated exposure to the housing segment in the strategies. This quarter, we further this emphasis by creating an overweight to Financials in lieu of Consumer Discretionary as well as introducing an overweight to value relative to growth at 60%/40% among all U.S. market capitalizations. Within the value category, we harbor concerns regarding energy companies as they are typically highly leveraged and currently have, and are expected to continue to have, difficulty in accessing the capital markets. This concern is mitigated by the fact that the Energy sector only represents roughly 2% of the large cap equity exposure in the strategies. In the Energy category, our preference is exposure to the underlying commodities as detailed in the Other Markets section later in this document. Among market capitalizations in the U.S., we favor small cap companies for the potential they offer in the recovery phase of the economic cycle.
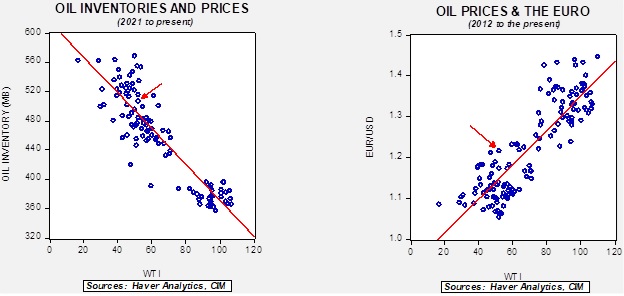
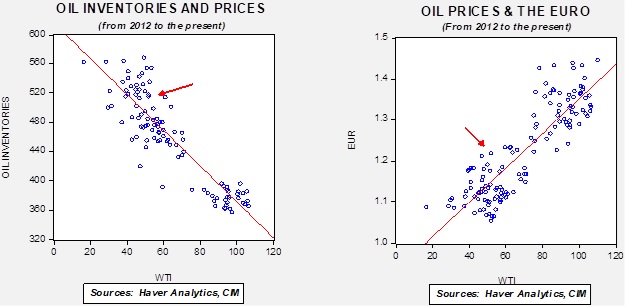
Regarding non-U.S. stocks, not only is the stage set by the same economic facets of stimulus, recovery, no inflation, and global liquidity, but we expect them to also benefit over the forecast period through the combination of attractive relative valuations and the potential for a weakening in the exchange rate of the U.S. dollar. The EU’s intention to issue €850 billion in common bonds to fund its COVID-19 recovery program may make taxation and spending decisions permanent at the EU, and consequently allow the euro to be a complementary currency. We think the recent strength of the euro versus the U.S. dollar not only reflects the conclusion of Brexit uncertainty, but also the competitive nature of the euro for global trade settlement. A weakening U.S. dollar acts as a very strong tailwind for U.S.-based investors. Given these expectations, we have increased the exposures to non-U.S. stocks.
BOND MARKET OUTLOOK
Expectations for low inflation and an aggressively accommodative Fed lead to our subdued view of the bond market over the three-year forecast period. As noted earlier, the potential exists for the Fed to exert a form of yield curve control whereby the Fed would announce its intentions to buy enough bonds of a specific maturity in order to contain rates within a particular target. Although we believe such a policy could be effective in stabilizing rates out to the 10-year maturity, the long bond would become the measure of inflation expectations. Moreover, research suggests that when yield curve control is used in combination with forward guidance and quantitative easing, it could lead to a lower and flatter yield curve.
Corporate bonds have enjoyed a dramatic narrowing of spreads since spiking in March of last year. Currently, spreads for investment-grade corporates are approaching the tightest levels experienced this century. Although we believe there is some room for further tightening, the risk/return trade-off for corporates with longer maturities makes them relatively unattractive. In contrast, the bond market environment we envision should be more constructive for mortgage-backed securities (MBS). As rates declined, prepayment speeds for MBS increased, lowering returns for investors. With rates at current levels, the likelihood for them to remain low over the forecast period, and continued purchases of MBS by the Fed as part of its unlimited quantitative easing program, we are more constructive on MBS than we have been over the past few years.
At this point, allocations to bonds are confined to strategies with income in their titles. Treasuries are overweight and corporate exposure has been lessened and restricted to intermediate maturities or shorter. Although still slightly underweight, exposure to MBS was increased in the latest strategy realignment. For strategies designed to generate tax-exempt income, all long-term municipal bond exposures were eliminated and replaced with ladders of target maturity municipal bond ETFs.
OTHER MARKETS
REIT exposure is retained in strategies where income is an objective as it affords a varied source of income. The increased weight of cell towers and data centers in the index has offset weakness seen by the office, retail, and hospitality segments.
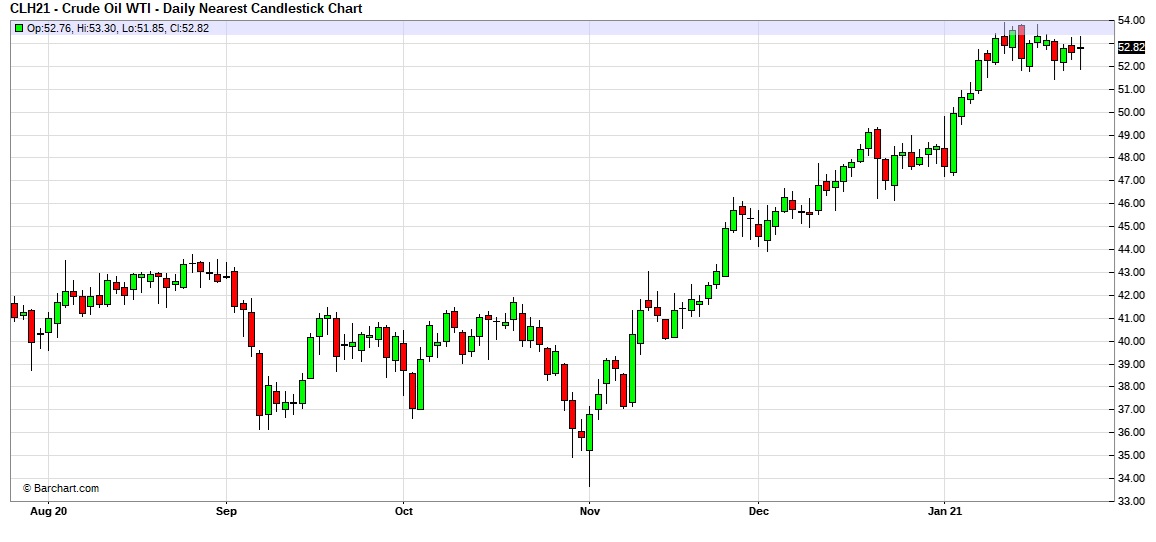
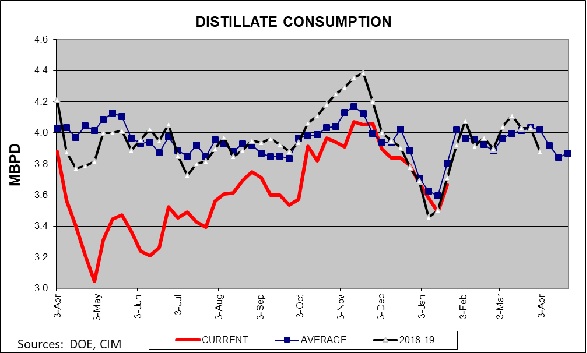
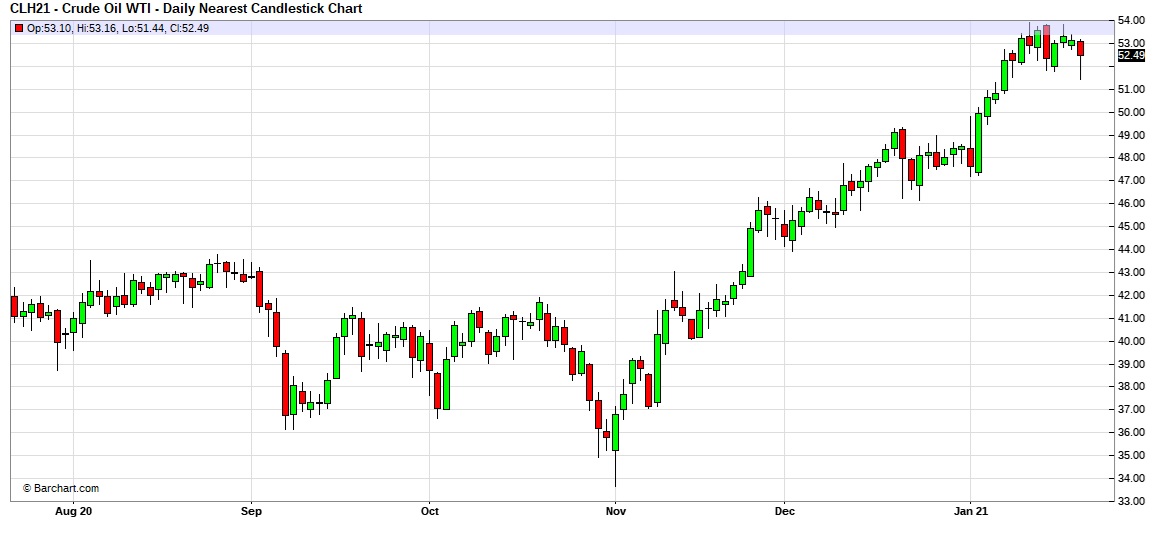
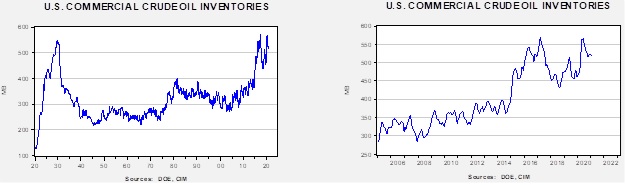
Gold is retained in the strategies as an important diversifier for heightened geopolitical risk and as a hedge against the potential for global currency debasement. However, a portion of the prior gold allocation was repositioned into a broad basket of commodities that contains a majority weight to energy components such as crude oil, natural gas, and heating oil as well as industrial metals. As noted previously, while we are constructive regarding the price of energy as the global recovery takes hold, the inaccessibility of capital markets for energy production companies encourages our exposure solely to the energy commodity components. A position in silver remains in the strategies designed for growth as we believe it is risk appropriate and its industrial uses make it attractive for an economic recovery.
Read the full report