

Author: Rebekah Stovall
Asset Allocation Weekly (November 20, 2020)
by Asset Allocation Committee | PDF
In the aftermath of the election and favorable news on vaccine progress, we have seen a notable backup in interest rates. The 10-year T-note yield is flirting with 1%. In this report, we will examine the future path of long-duration interest rates.
We start with our 10-year T-note yield model.
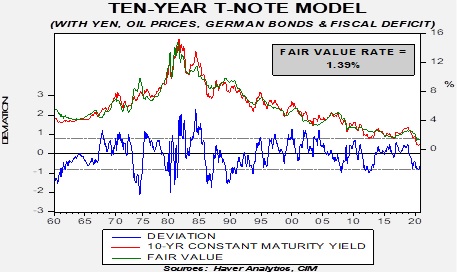
The model, which uses fed funds, the 15-year average of CPI (an inflation expectations proxy), the JPY/USD exchange rate, oil prices, German 10-year bond yields, and the fiscal deficit, suggests the fair value yield is near 140 bps. Although this fair value is historically low, it is well above the current rate of around 90 bps. In the absence of outside interference, it would not be unreasonable to expect yields to continue to drift higher. However, we do expect weaker economic growth in Q4 2020 and Q1 2021, so the pace of increases may slow.
However, the potential for outside intervention is high. The issue comes down to Federal Reserve policy. The U.S. central bank has hinted at the possibility of yield curve control. So far, the Fed has not taken concrete steps to implement fixing long-duration interest rates. But a rapid rise in such rates would not be welcome because it would have an adverse effect on the mortgage and housing markets.
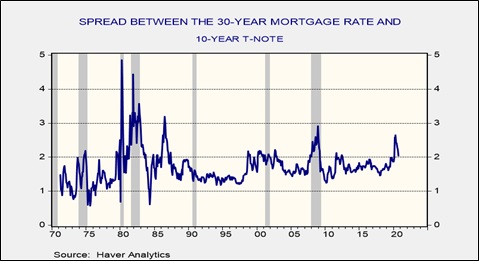
Mortgage rates, relative to the 10-year Treasury, spiked in April. The spread has narrowed since then but remains above 2%, which is elevated. If rising T-note rates lead to higher mortgage rates, it will tend to stifle part of the economy that is showing promise. This may lead the Fed to try to slow the rise in long-duration interest rates.
At the same time, a low interest rate regime tends to act as a headwind for banks. This factor may encourage the Fed to allow long-term rates to rise modestly. But we doubt that policymakers would be comfortable with a 10-year T-note yield in excess of 1.25%. If rates approach that level soon, we would not be surprised to see the Fed signal it isn’t pleased with the development. And so, we may see a further rise in long-term interest rates, but a move to revert to the rate levels seen before 2008 is improbable.
Weekly Energy Update (November 19, 2020)
by Bill O’Grady, Thomas Wash, and Patrick Fearon-Hernandez, CFA | PDF
(N.B. Due to the Thanksgiving Day holiday, the next report will be published on December 3.)
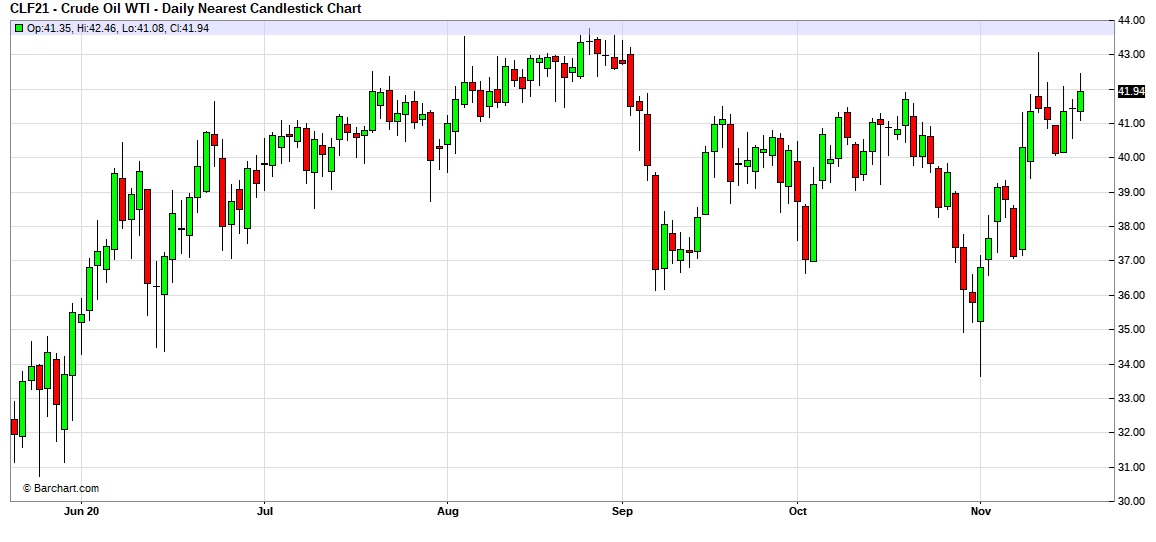
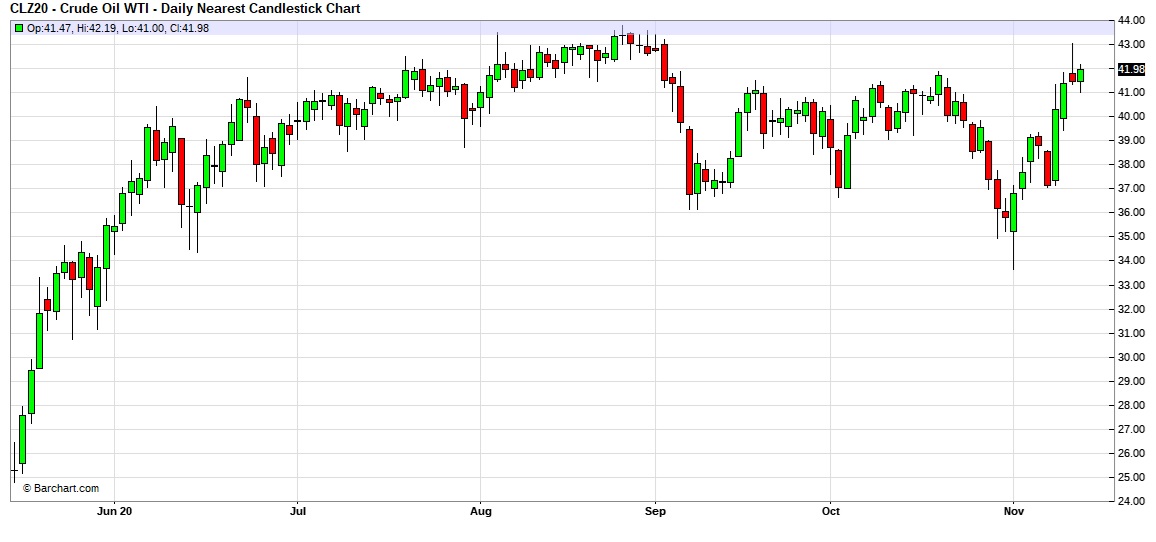
Here is an updated crude oil price chart. Positive news on a vaccine for COVID-19 led to a strong rally this week, taking prices to the upper end of the current trading range.
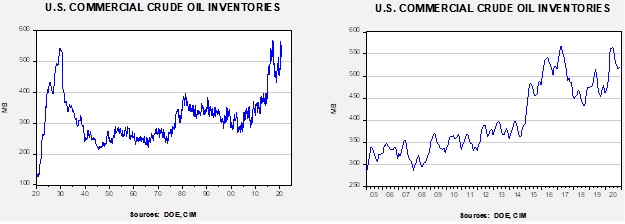
Commercial crude oil inventories rose 0.8 mb when a 1.6 mb draw was expected. The SPR declined 0.4 mb; since peaking at 656.1 mb in July, the SPR has drawn 17.7 mb. Given levels in April, we expect that another 4.7 mb will be withdrawn as this oil was placed in the SPR for temporary storage. Taking the SPR into account, storage rose 0.4 mb. The data was mostly unaffected by tropical activity this week.
In the details, U.S. crude oil production rose 0.4 mbpd to 10.9 mbpd. Exports were unchanged, while imports fell 0.2 mbpd. Refining activity rose 2.9%.
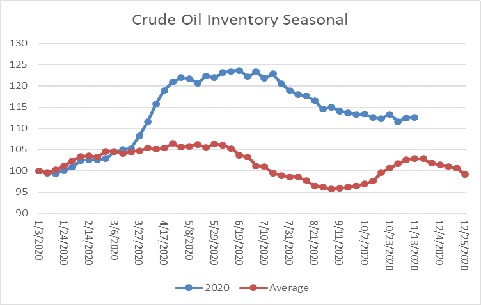
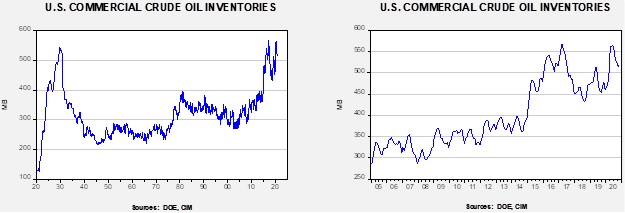
The above chart shows the annual seasonal pattern for crude oil inventories. This week’s data showed a rise in crude oil stockpiles, which is normal. Inventories are approaching their second seasonal peak. Thus, after next week we would expect a steady slide in oil inventories.
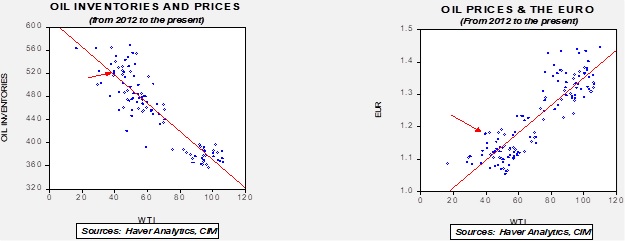
Based on our oil inventory/price model, fair value is $43.67; using the euro/price model, fair value is $62.98. The combined model, a broader analysis of the oil price, generates a fair value of $52.18. The wide divergence continues between the EUR and oil inventory models. However, current oil prices are below all three measures of fair value, suggesting that oil prices are likely undervalued.
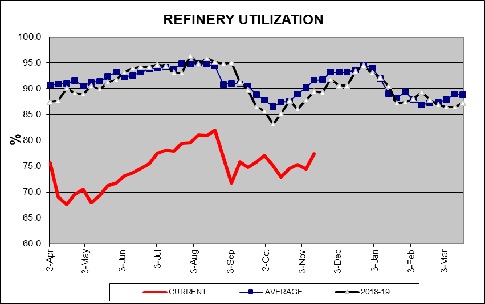
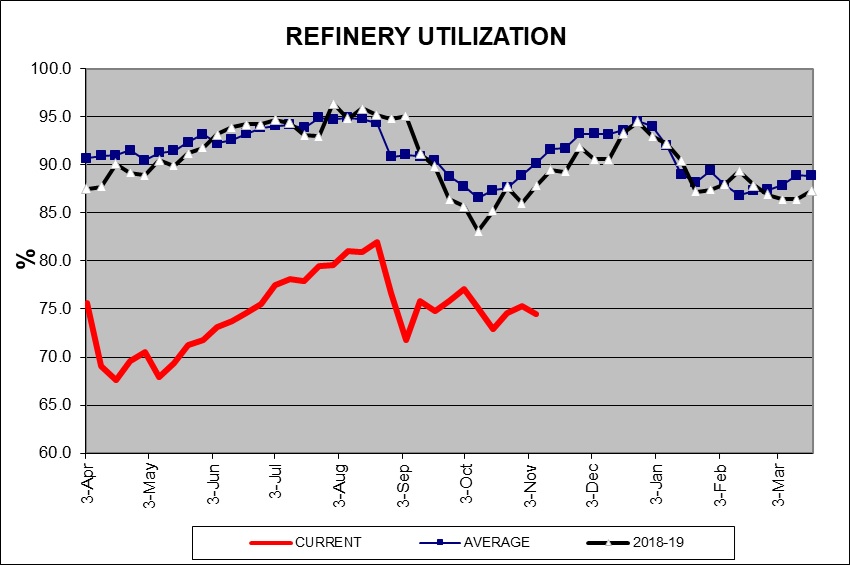
Refinery operations did bounce back this week, rising 2.9%, well better than the 0.6% rise expected. We are in a period of the year when refinery operations are usually increasing, so we will see if this week’s increase has any follow through. If it does, it is supportive for oil prices.
In oil market news, there is hope that OPEC+ will do something to lift prices; technical meetings were held this week in anticipation of the ministerial meeting at the end of the month. Little emerged from the meetings, but that isn’t a surprise. We doubt the cartel will do much at the end of the month other than extend current production levels.
Oil companies are starting to face state-level lawsuits against them for climate mitigation. The industry is moving to push these suits into federal courts to manage them more easily.
Our working assumption is that Joe Biden will be the next president, but until the Electoral College meets next month the election isn’t over. And, until January 20, President Trump is still running the U.S. government. There is a lot of activity that will likely make it difficult for a new president to unwind. First, we are seeing the Department of the Interior call for nominations for drilling in ANWR for lease sales next month. Although this will be a hot button issue that will get much media play, we don’t expect aggressive bidding. Most oil companies are trying to “green” themselves and drilling in ANWR won’t help in those efforts.
In addition to Alaska, the Middle East is also a sensitive area. There were three items of interest. First, although President Trump has shown restraint in directly attacking Iran, apparently he investigated launching air strikes on Iran’s nuclear program. Iran has been boosting its enriched stockpiles since the U.S. broke away from the Obama-era nuclear deal. Second, Al Qaeda’s second-in-command, Abu Muhammad al-Masri, was apparently assassinated in Iran. There are reports that Israel was responsible, but these have not been confirmed. He died in early August. There are rumors, also unconfirmed, that Ayman al-Zawahiri, the head of Al Qaeda, is also dead. It is not obvious why such a senior leader of Al Qaeda was in Iran, but it looks like Tehran wanted to suppress the news. Third, Saudi Aramco (2222, SAR, 35.50) has decided to tap the bond markets to ensure it can pay its dividend. The fact that the company is willing to borrow to pay the dividend suggests it is committed to being a steady source of income to its shareholders.
On a related note, Saudi Arabia reiterated that it reserves the right to acquire nuclear weapons. This statement is likely a signal to an incoming Biden administration that if Iran cannot be prevented from getting a nuclear weapon, then an arms race in the region is likely.
For the first time since the Gulf War, the border crossing at Arar, on the Iraq/Saudi frontier, has reopened. The reopening is a potential signal of a decline in Iran’s influence on Baghdad.
On the unconventional energy front, U.K. researchers are working on a technology to turn plastic waste into hydrogen. Here is a primer on hydrogen as a fuel. The state of Arizona is moving forward on carbon-free energy rules but has rejected a specific role for renewables, which means that hydroelectric and nuclear are the most likely remaining options.
View PDF
Weekly Geopolitical Report – An Ant Problem (November 16, 2020)
by Bill O’Grady | PDF
Although the U.S. elections were the major story during the first week of November, another notable, but somewhat overshadowed, event did occur, namely, when Chinese regulators forced Ant Group to suspend its initial public offering. Ant Group, an affiliated firm of Alibaba Group (BABA, USD 294.04), was preparing to launch an IPO. The listing, estimated to be $37 billion, would have been the largest IPO in financial market history. The new stock was to be listed on the Shanghai and Hong Kong exchanges, shunning New York and London. Investors flocked to the expected new issue, leading to a massive oversubscription of 870x, or $2.8 trillion. The IPO attracted preorders from investors as broad as sovereign wealth funds to individual investors. Many of those small investors borrowed money to purchase shares. There were rumors that some Hong Kong broker/dealers were allowing investors to borrow up to 20x their initial stake.
Given these conditions, the decision to pull the IPO was surprising. In this report, we will offer background on Ant Group. We will discuss the concerns of regulators and examine the motivations for such a controversial and potentially damaging decision. This decision will likely undermine foreign investor confidence in China’s regulatory regime and impact Beijing’s attempt to woo investors into China and internationalize its currency. As always, we will close with market ramifications.
Asset Allocation Weekly – #19 (Posted 11/13/20)
Asset Allocation Weekly (November 13, 2020)
by Asset Allocation Committee | PDF
In our most recent Asset Allocation quarterly rebalance, we addressed the potential for election-related market disruption. In the end, we made only modest defensive adjustments to the portfolios and instead focused our allocations on continued policy support and economic recovery. In this week’s report, we will look at the current impact of the election on equity markets.
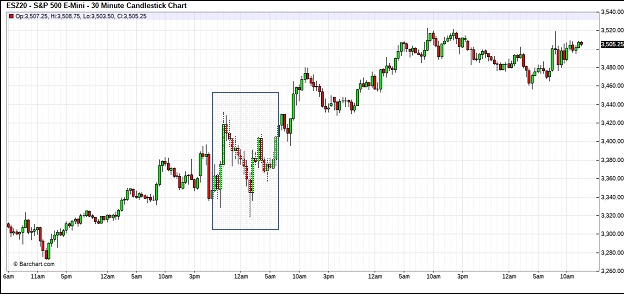
This is a five-day chart of the December S&P futures contract. We have placed a box on election night. Market volatility was clearly elevated as we saw sizable rallies and pullbacks. But, for the rest of the week, equity prices have continued to recover.
One of the questions we have been getting is, given all the turmoil and uncertainty, why are equities rising? The key point is that equities were pricing in some element of a “tail risk” outcome—a hung election and widespread civil unrest. Media reports that retailers were boarding up windows suggested that these concerns were not idle. Gun sales were at historic levels going into the election. So, clearly, fear levels were high.
One of the more difficult issues for a young analyst is understanding the discounting power of financial markets. In many respects, financial markets account for the sum of our fears. And so, it is not uncommon that even when an event occurs as expected, financial market prices will reverse from what a casual observer would assume would occur. The adage is “buy rumor, sell fact.” In the spring, when we first began investigating the potential for a hung election and a Constitutional crisis, the topic was still rather obscure. By Labor Day, it had become “common knowledge.” When an issue becomes common knowledge, financial markets quickly discount the event.
Although equities generally held their value through the election (prices peaked around Labor Day and were rangebound thereafter), there were two areas where there was clear evidence of risk mitigation. The first was accumulation of cash.
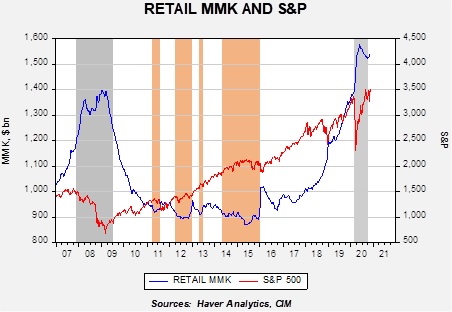
This chart shows retail money market funds (RMMK) and the S&P 500 on a weekly basis. Retail investors started building cash positions in 2018 around the onset of trade tensions with China and aggressively added to cash this year. Although RMMK did ease with the recovery in the S&P, levels remain elevated and suggest high levels of fear. If we get through the election without significant civil strife, there is ample liquidity to support equities.
The second area was volatility futures.
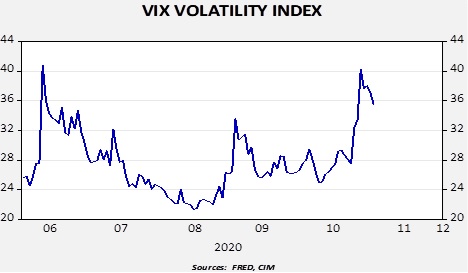
The “VIX” is a measure of implied volatility from the S&P 500 options market. When option buyers pay higher prices for options, it gets translated as higher implied volatility. Essentially, if they are buying put options, they are protecting for a wider dispersion of prices. This chart shows daily prices for the index; in the third week of October, the VIX rose sharply as the election approached, suggesting rising levels of fear.
If the worst of the election risk has passed, these “insurance” positions will likely be unwound. If so, that would tend to support higher equity prices in the coming months. In other words, the return of cash to the markets and the reduction of put-buying would be supportive.
Weekly Energy Update (November 13, 2020)
by Bill O’Grady, Thomas Wash, and Patrick Fearon-Hernandez, CFA | PDF
Here is an updated crude oil price chart. Positive news on a vaccine for COVID-19 led to a strong rally this week, taking prices to the upper end of the current trading range.
Commercial crude oil inventories rose 4.3 mb when a 2.0 mb draw was expected. The SPR declined 0.6 mb; since peaking at 656.1 mb in July, the SPR has drawn 17.3 mb. Given levels in April, we expect that another 5.1 mb will be withdrawn as this oil was placed in the SPR for temporary storage. Taking the SPR into account, storage rose 3.7 mb. The data was probably unaffected by tropical activity this week, but next week’s report could see international trade activity affected as Hurricane Eta moved across the Gulf of Mexico.
In the details, U.S. crude oil production was unchanged at 10.5 mbpd. Exports and imports both rose 0.5 mbpd. Refining activity fell 0.8%.
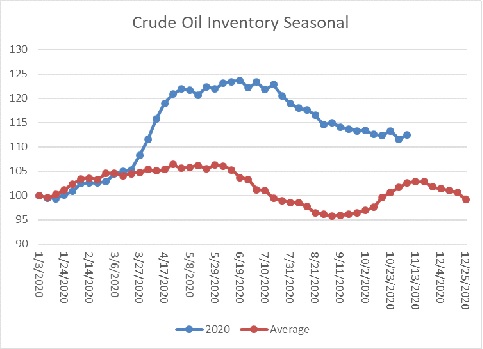
The above chart shows the annual seasonal pattern for crude oil inventories. This week’s data showed a rise in crude oil stockpiles, which is normal. Inventories are approaching their second seasonal peak. Thus, after next week, we would expect a steady slide in oil inventories.
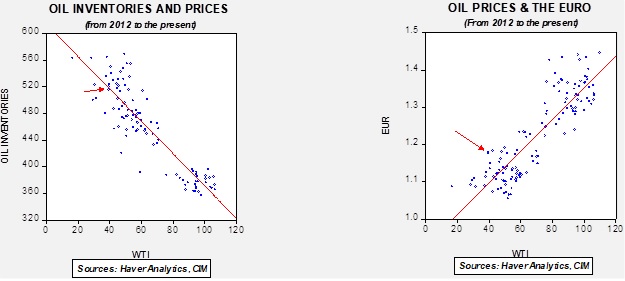
Based on our oil inventory/price model, fair value is $43.92; using the euro/price model, fair value is $62.37. The combined model, a broader analysis of the oil price, generates a fair value of $52.09. The wide divergence continues between the EUR and oil inventory models. However, current oil prices are below all three measures of fair value, suggesting that oil prices are likely undervalued.
Refinery operations fell 0.8%, which was better than the -1.6% expected. However, the seasonal pattern usually shows rising utilization by now. The lack of a recovery in utilization is bearish news for crude oil prices and is reflected in the falling crude oil demand forecasts discussed below.
OPEC has lowered its demand forecast again, now projecting that demand will fall by 9.8 mbpd in 2020, another reduction of 0.3 mbpd. Given this decline, it is more likely that the cartel will not increase production quotas anytime soon. The IEA lowered its demand forecast as well, cutting its consumption expectations by 0.4 mbpd to an 8.8 mbpd reduction for this year. Both of these declines are tied to concerns about the rise in COVID-19 cases and expectations that the distribution of a vaccine will be globally slow.
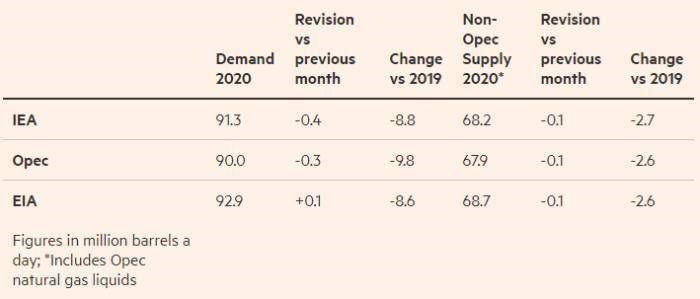
As the table above shows, OPEC is the most pessimistic about global demand but expects a larger drop in non-OPEC supply.
One of the most potentially bearish factors for oil would be a reduction in sanctions on Iran. Candidate Biden has suggested he would like to return to the Iran nuclear deal, but there are a number of complications. First, this would require Iran to return to compliance to the earlier pact. Given that Iran’s enrichment activity has accelerated, it is hard to see how Tehran could be accommodated on this issue. Would Iran have to send that fuel to another nation? Would it allow foreign observers to check compliance? Second, it appears to us that the deal the Obama administration made with Iran was likely thought to be a first step in a broader agreement on missiles and militia activity. The assumption was that the future Clinton administration would have pursued these goals. But the Trump administration took a far different stance. Still, these other issues are important and are stumbling blocks to future relations. Finally, we find it hard to believe that Iran would be open to any agreement with the U.S. It is clear that the U.S. is politically divided, and had it not been for the pandemic, President Trump would have likely gotten a second term. Any agreement made with a Biden administration could just as easily be reversed in 2024. Thus, there is a risk to oil prices from a return of Iran, but the likelihood is probably rather small.
In Middle East news, we are seeing a rise in terrorist activity in Saudi Arabia. There was a bombing at a WWI commemoration ceremony in Jeddah yesterday, a meeting that was attended by Western diplomats. This follows a fatal knife attack by a Saudi national on a security guard at the French consulate in Jeddah. It appears that France is the target of these attacks due to recent unrest tied to the Macron government’s Islamic policy. In Bahrain, PM Prince Khalifa bin Salman Al Khalifa died at the age of 84. He has held the office since Bahrain’s independence in 1971. He was considered a hardliner and his replacement, Crown Prince Salman bin Hamad Al Khalifa, is thought to be more of a moderate. Bahrain is the home of the U.S. 5th Fleet and Navy Central Command. Thus, this change in power does have potential ramifications.
The oil majors are moving to diversify their energy sources in order to prepare for the seemingly inevitable shift away from hydrocarbons. BP (BP, USD, 19.10) has announced a joint program with Orsted (OMX, DKK, 1125.50) to use wind energy to create hydrogen. The plan is to separate hydrogen from water using electricity from Orsted’s wind farms.
Rolls Royce (RYCEY, USD 3.05) announced it will build 16 modular nuclear power plants in the U.K. The idea is to build smaller, repeatable plants that will give the U.K. an edge in this technology and help the country reach its greenhouse gas targets.
Although coal consumption has been falling for several years, the recent lift in natural gas prices will likely foster a lift in consumption. Although we suspect the trend in place of falling coal usage is likely to continue, we may see a bounce in coal activity into spring.
View PDF
Weekly Geopolitical Report – Revolution in Kyrgyzstan (November 9, 2020)
by Thomas Wash | PDF
Around 20,000 protesters took to the streets in the Kyrgyzstan capital of Bishkek following parliamentary elections on October 4. Social media posts and news reports of alleged vote-buying and registration fraud sparked outrage when 107 out of 120 parliamentary seats went to parties loyal to President Sooronbay Jeenbekov, a surprising result compared to polls that suggested a competitive race.
Motivated by opposition parties who lost, protesters stormed and ransacked the presidential palace oft referred to as the “White House,” forcing the president to flee for his safety. The struggle for control resulted in protesters claiming to have taken over the building. The incident left 590 injured and one dead. In order to calm tensions, President Jeenbekov agreed to resign and put in place an interim government. As a result, presidential elections are expected to be held on January 10, 2021, while parliamentary elections are anticipated to take place by June 2021.
This is the third time in the country’s thirty-year history that a president was ousted from office following a contested election. This has not gone unnoticed by its biggest allies, China and Russia, which support the country with aid and services. Russia has expressed displeasure with the interim government, while China has yet to acknowledge it. Although the two compete for influence over the region, it is becoming clear they are growing concerned with its frequent instability.
In this report, we will discuss the potential geopolitical ramifications of the recent events in Kyrgyzstan. We will start off with a brief overview of the history and geography of the region, followed by an examination of recent events in more detail and what is likely to happen over the coming months. As always, we will conclude this report by discussing how markets might be affected.