by Asset Allocation Committee | PDF
In his book entitled The Counter-Revolution in Monetary Theory, Milton Friedman states that, “Inflation is always and everywhere a monetary phenomenon in a sense that it is and can be produced only by a more rapid increase in the quantity of money than in output.” This sentiment shaped both monetary and fiscal policy over the last 40 years, and we are finally seeing this theory pushed to its limit. The monetary supply, as defined by M2, has risen nearly 21% since February, its fastest pace ever recorded. Pundits and politicians alike have already begun sounding the alarm of possible runaway inflation if measures aren’t taken to counter this unprecedented rise in the money supply.
Despite Friedman’s prediction, inflation in the U.S. has slowed. Since March, the annual change in inflation has risen only 0.8%. In fact, certain categories have even seen a decline in their overall price level. The prices for energy and transportation services are down 8% and 5%, respectively, from the prior year. In this Asset Allocation Weekly, we will discuss the impact monetary expansion has had on consumer prices so far and what we expect going forward.
The correlation between the money supply and inflation has always been subject to dispute. The crux of the debate is based on whether one believes the velocity of money, which is output divided by the money supply, is constant. If velocity is constant, then inflation is caused whenever the growth of the money supply outpaces the growth in goods and services produced. However, if velocity is not constant, then the impact that the money supply has on inflation is ambiguous at best.
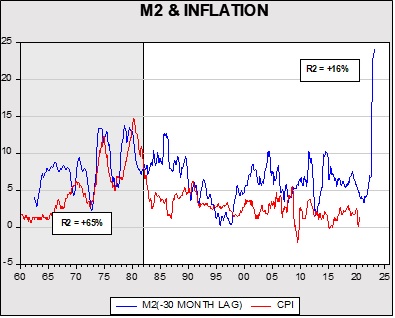
When Milton Friedman made his comments in 1970, there was some evidence that inflation and money supply were highly correlated, albeit at a nearly three-year lag. Nevertheless, this correlation began to break down in the mid-1980s as 1) financial deregulation made it harder to determine whether households were saving for future spending or for other reasons (e.g., holding cash as an asset), and 2) globalization and deregulation flattened the aggregate supply curve, changing the impact of rising aggregate demand on price levels. As a result, the money supply became more volatile over time as goods, commodities specifically, became a less important factor in determining inflation.[1] Hence, volatility became less stable over time, thereby breaking the direct link between inflation and the money supply.
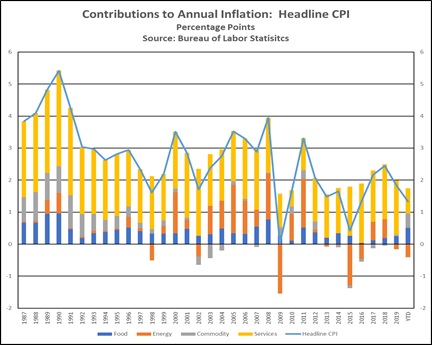
This pandemic was not an exception to this dynamic as disinflation ensued in the face of an unprecedented amount of fiscal and monetary stimulus. So far, CPI has risen at an annualized rate of 1.77%, down from the previous year’s rate of 2.85%. The primary drag on inflation is coming from the energy and services sectors, which have both been adversely impacted by the pandemic. Energy prices are down nearly 8% from the prior year, while services, which is the primary driver of inflation, has slowed from an annual rise of 3.1% in February to 1.9% in September. That being said, the stimulus may have supported stronger commodity prices as demand for vehicles has surged. Used cars, in particular, benefited from the stimulus as prices rose 10% from the prior year.[2]
Furthermore, the likelihood of runaway inflation similar to what we saw in the 1970s and early 1980s is slim. Imported goods from abroad will likely prevent food and commodity prices from rising substantially, while prices for services will likely remain low as owners seek to recover their losses and attract customers. The biggest threats to inflation are more likely to come from a weaker dollar resulting in higher import prices and a change in regulation that constrains imports or productive capacity.
In summary, inflation is unlikely to reach the heights seen during the 1970s and early 1980s as the link between the money supply and inflation has been broken for quite some time. A weaker dollar and sudden changes to government regulation are probably bigger inflationary risks. In the meantime, we suspect that stable inflation will likely support stronger performance of financial assets, especially equities compared to bonds. Residential real estate could also benefit.
[1] The term “commodities” refers to goods such as apparel, used and new vehicles, etc. Please check our associated AAW chart book for more detail.
[2] Hence, now is a good time to finally get rid of that old clunker in the garage.