Although the U.S. elections were the major story during the first week of November, another notable, but somewhat overshadowed, event did occur, namely, when Chinese regulators forced Ant Group to suspend its initial public offering. Ant Group, an affiliated firm of Alibaba Group (BABA, USD 294.04), was preparing to launch an IPO. The listing, estimated to be $37 billion, would have been the largest IPO in financial market history. The new stock was to be listed on the Shanghai and Hong Kong exchanges, shunning New York and London. Investors flocked to the expected new issue, leading to a massive oversubscription of 870x, or $2.8 trillion. The IPO attracted preorders from investors as broad as sovereign wealth funds to individual investors. Many of those small investors borrowed money to purchase shares. There were rumors that some Hong Kong broker/dealers were allowing investors to borrow up to 20x their initial stake.
Given these conditions, the decision to pull the IPO was surprising. In this report, we will offer background on Ant Group. We will discuss the concerns of regulators and examine the motivations for such a controversial and potentially damaging decision. This decision will likely undermine foreign investor confidence in China’s regulatory regime and impact Beijing’s attempt to woo investors into China and internationalize its currency. As always, we will close with market ramifications.
In our most recent Asset Allocation quarterly rebalance, we addressed the potential for election-related market disruption. In the end, we made only modest defensive adjustments to the portfolios and instead focused our allocations on continued policy support and economic recovery. In this week’s report, we will look at the current impact of the election on equity markets.
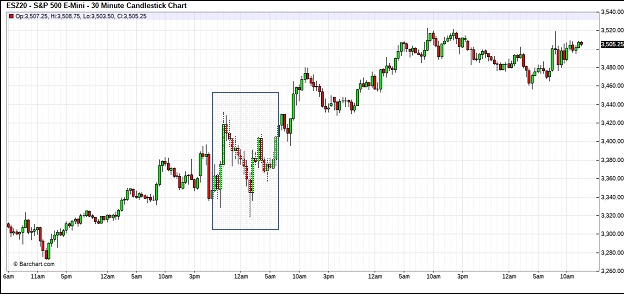
(Source: Barchart.com)
This is a five-day chart of the December S&P futures contract. We have placed a box on election night. Market volatility was clearly elevated as we saw sizable rallies and pullbacks. But, for the rest of the week, equity prices have continued to recover.
One of the more difficult issues for a young analyst is understanding the discounting power of financial markets. In many respects, financial markets account for the sum of our fears. And so, it is not uncommon that even when an event occurs as expected, financial market prices will reverse from what a casual observer would assume would occur. The adage is “buy rumor, sell fact.” In the spring, when we first began investigating the potential for a hung election and a Constitutional crisis, the topic was still rather obscure. By Labor Day, it had become “common knowledge.” When an issue becomes common knowledge, financial markets quickly discount the event.
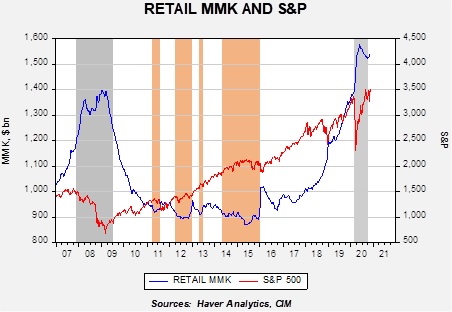
Although equities generally held their value through the election (prices peaked around Labor Day and were rangebound thereafter), there were two areas where there was clear evidence of risk mitigation. The first was accumulation of cash.
This chart shows retail money market funds (RMMK) and the S&P 500 on a weekly basis. Retail investors started building cash positions in 2018 around the onset of trade tensions with China and aggressively added to cash this year. Although RMMK did ease with the recovery in the S&P, levels remain elevated and suggest high levels of fear. If we get through the election without significant civil strife, there is ample liquidity to support equities.
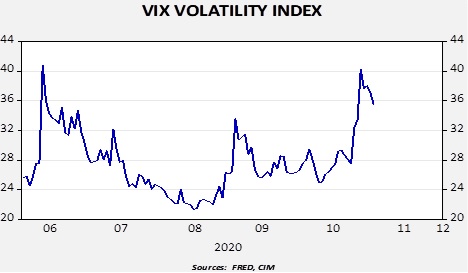
The second area was volatility futures.
The “VIX” is a measure of implied volatility from the S&P 500 options market. When option buyers pay higher prices for options, it gets translated as higher implied volatility. Essentially, if they are buying put options, they are protecting for a wider dispersion of prices. This chart shows daily prices for the index; in the third week of October, the VIX rose sharply as the election approached, suggesting rising levels of fear.
If the worst of the election risk has passed, these “insurance” positions will likely be unwound. If so, that would tend to support higher equity prices in the coming months. In other words, the return of cash to the markets and the reduction of put-buying would be supportive.
by Bill O’Grady, Thomas Wash, and Patrick Fearon-Hernandez, CFA | PDF
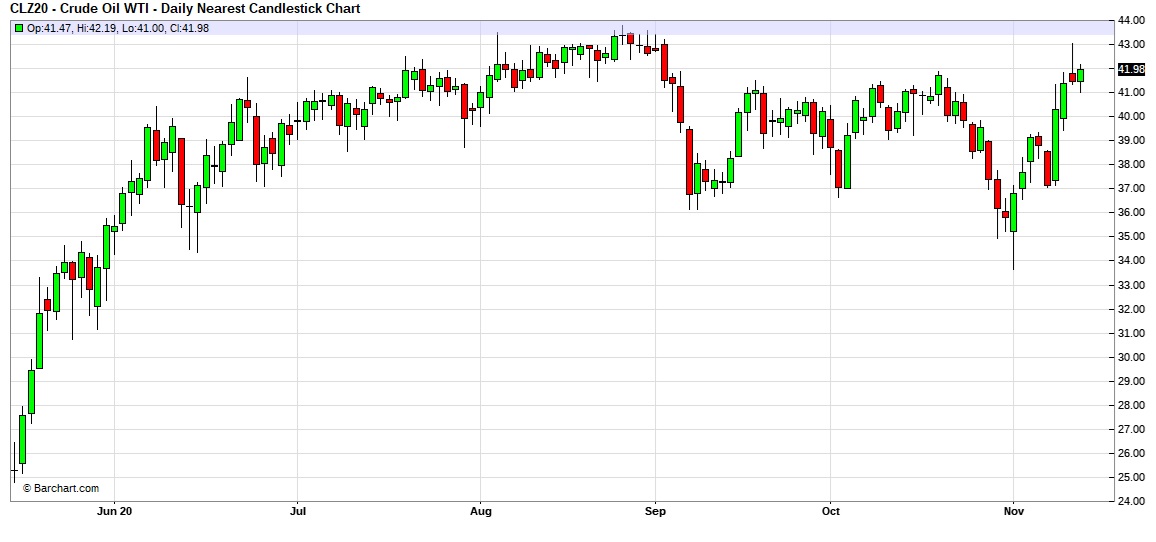
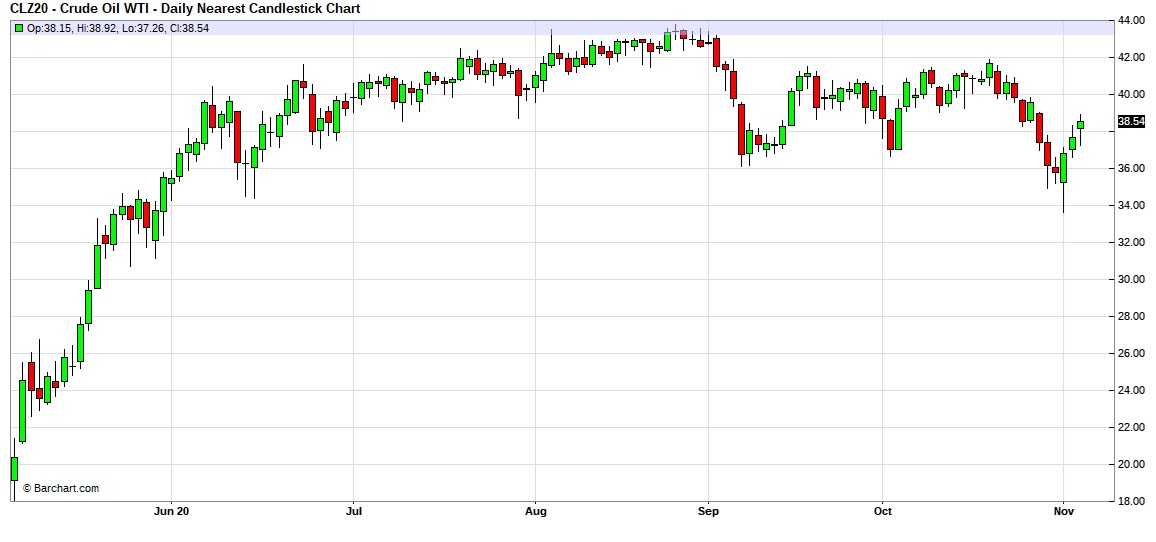
Here is an updated crude oil price chart. Positive news on a vaccine for COVID-19 led to a strong rally this week, taking prices to the upper end of the current trading range.
(Source: Barchart.com)
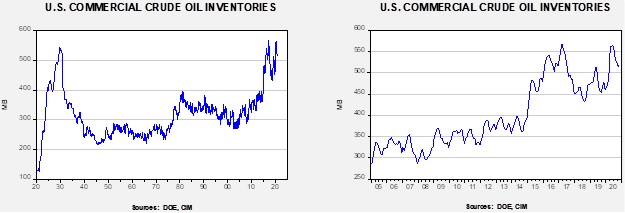
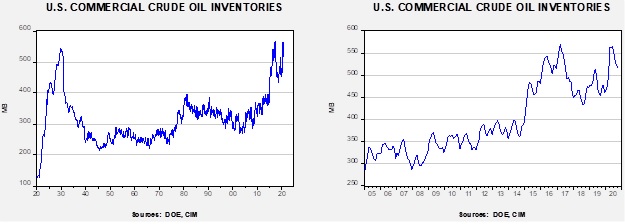
Commercial crude oil inventories rose 4.3 mb when a 2.0 mb draw was expected. The SPR declined 0.6 mb; since peaking at 656.1 mb in July, the SPR has drawn 17.3 mb. Given levels in April, we expect that another 5.1 mb will be withdrawn as this oil was placed in the SPR for temporary storage. Taking the SPR into account, storage rose 3.7 mb. The data was probably unaffected by tropical activity this week, but next week’s report could see international trade activity affected as Hurricane Eta moved across the Gulf of Mexico.
In the details, U.S. crude oil production was unchanged at 10.5 mbpd. Exports and imports both rose 0.5 mbpd. Refining activity fell 0.8%.
(Sources: DOE, CIM)
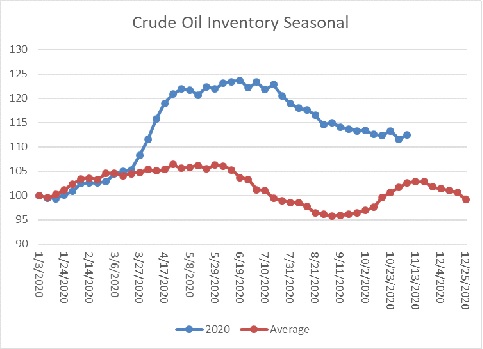
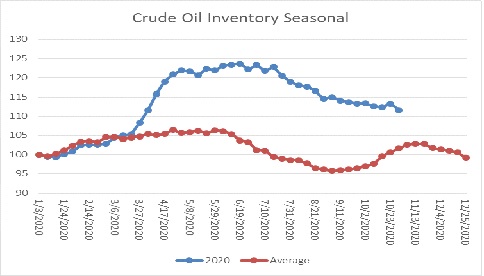
The above chart shows the annual seasonal pattern for crude oil inventories. This week’s data showed a rise in crude oil stockpiles, which is normal. Inventories are approaching their second seasonal peak. Thus, after next week, we would expect a steady slide in oil inventories.
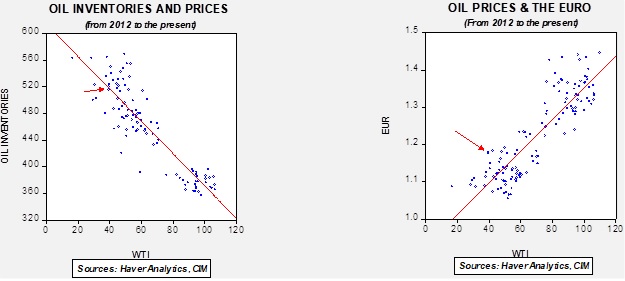
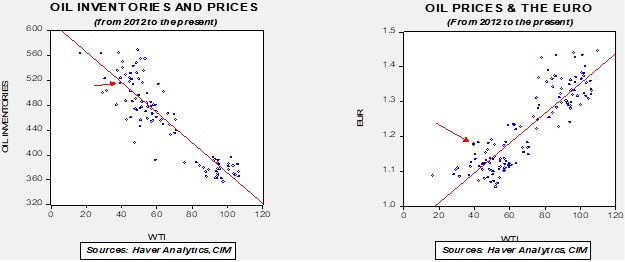
Based on our oil inventory/price model, fair value is $43.92; using the euro/price model, fair value is $62.37. The combined model, a broader analysis of the oil price, generates a fair value of $52.09. The wide divergence continues between the EUR and oil inventory models. However, current oil prices are below all three measures of fair value, suggesting that oil prices are likely undervalued.
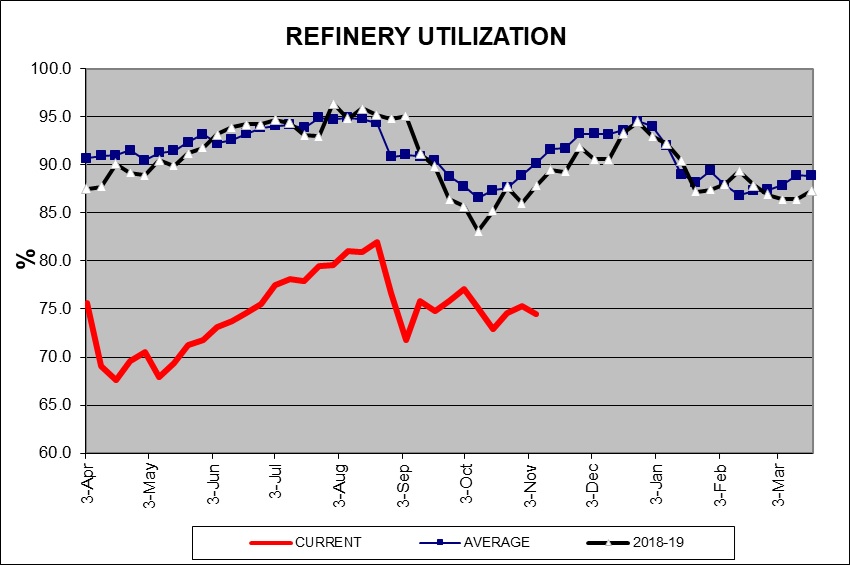
Refinery operations fell 0.8%, which was better than the -1.6% expected. However, the seasonal pattern usually shows rising utilization by now. The lack of a recovery in utilization is bearish news for crude oil prices and is reflected in the falling crude oil demand forecasts discussed below.
(Sources: DOE, CIM)
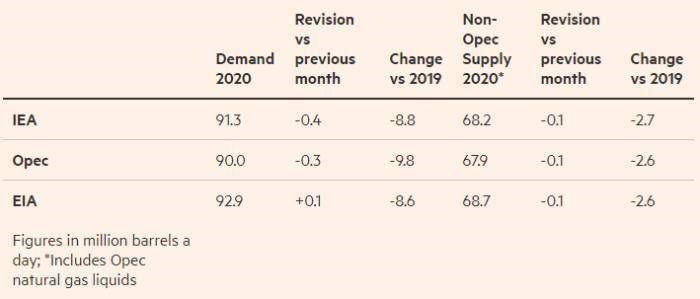
OPEC has lowered its demand forecast again, now projecting that demand will fall by 9.8 mbpd in 2020, another reduction of 0.3 mbpd. Given this decline, it is more likely that the cartel will not increase production quotas anytime soon. The IEA lowered its demand forecast as well, cutting its consumption expectations by 0.4 mbpd to an 8.8 mbpd reduction for this year. Both of these declines are tied to concerns about the rise in COVID-19 cases and expectations that the distribution of a vaccine will be globally slow.
(Source: FT)
As the table above shows, OPEC is the most pessimistic about global demand but expects a larger drop in non-OPEC supply.
One of the most potentially bearish factors for oil would be a reduction in sanctions on Iran. Candidate Biden has suggested he would like to return to the Iran nuclear deal, but there are a number of complications. First, this would require Iran to return to compliance to the earlier pact. Given that Iran’s enrichment activity has accelerated, it is hard to see how Tehran could be accommodated on this issue. Would Iran have to send that fuel to another nation? Would it allow foreign observers to check compliance? Second, it appears to us that the deal the Obama administration made with Iran was likely thought to be a first step in a broader agreement on missiles and militia activity. The assumption was that the future Clinton administration would have pursued these goals. But the Trump administration took a far different stance. Still, these other issues are important and are stumbling blocks to future relations. Finally, we find it hard to believe that Iran would be open to any agreement with the U.S. It is clear that the U.S. is politically divided, and had it not been for the pandemic, President Trump would have likely gotten a second term. Any agreement made with a Biden administration could just as easily be reversed in 2024. Thus, there is a risk to oil prices from a return of Iran, but the likelihood is probably rather small.
In Middle East news, we are seeing a rise in terrorist activity in Saudi Arabia. There was a bombing at a WWI commemoration ceremony in Jeddah yesterday, a meeting that was attended by Western diplomats. This follows a fatal knife attack by a Saudi national on a security guard at the French consulate in Jeddah. It appears that France is the target of these attacks due to recent unrest tied to the Macron government’s Islamic policy. In Bahrain, PM Prince Khalifa bin Salman Al Khalifa died at the age of 84. He has held the office since Bahrain’s independence in 1971. He was considered a hardliner and his replacement, Crown Prince Salman bin Hamad Al Khalifa, is thought to be more of a moderate. Bahrain is the home of the U.S. 5th Fleet and Navy Central Command. Thus, this change in power does have potential ramifications.
Rolls Royce (RYCEY, USD 3.05) announced it will build 16 modular nuclear power plants in the U.K. The idea is to build smaller, repeatable plants that will give the U.K. an edge in this technology and help the country reach its greenhouse gas targets.
Although coal consumption has been falling for several years, the recent lift in natural gas prices will likely foster a lift in consumption. Although we suspect the trend in place of falling coal usage is likely to continue, we may see a bounce in coal activity into spring.
Around 20,000 protesters took to the streets in the Kyrgyzstan capital of Bishkek following parliamentary elections on October 4. Social media posts and news reports of alleged vote-buying and registration fraud sparked outrage when 107 out of 120 parliamentary seats went to parties loyal to President Sooronbay Jeenbekov, a surprising result compared to polls that suggested a competitive race.
Motivated by opposition parties who lost, protesters stormed and ransacked the presidential palace oft referred to as the “White House,” forcing the president to flee for his safety. The struggle for control resulted in protesters claiming to have taken over the building. The incident left 590 injured and one dead. In order to calm tensions, President Jeenbekov agreed to resign and put in place an interim government. As a result, presidential elections are expected to be held on January 10, 2021, while parliamentary elections are anticipated to take place by June 2021.
This is the third time in the country’s thirty-year history that a president was ousted from office following a contested election. This has not gone unnoticed by its biggest allies, China and Russia, which support the country with aid and services. Russia has expressed displeasure with the interim government, while China has yet to acknowledge it. Although the two compete for influence over the region, it is becoming clear they are growing concerned with its frequent instability.
In this report, we will discuss the potential geopolitical ramifications of the recent events in Kyrgyzstan. We will start off with a brief overview of the history and geography of the region, followed by an examination of recent events in more detail and what is likely to happen over the coming months. As always, we will conclude this report by discussing how markets might be affected.
In his book entitled The Counter-Revolution in Monetary Theory, Milton Friedman states that, “Inflation is always and everywhere a monetary phenomenon in a sense that it is and can be produced only by a more rapid increase in the quantity of money than in output.” This sentiment shaped both monetary and fiscal policy over the last 40 years, and we are finally seeing this theory pushed to its limit. The monetary supply, as defined by M2, has risen nearly 21% since February, its fastest pace ever recorded. Pundits and politicians alike have already begun sounding the alarm of possible runaway inflation if measures aren’t taken to counter this unprecedented rise in the money supply.
Despite Friedman’s prediction, inflation in the U.S. has slowed. Since March, the annual change in inflation has risen only 0.8%. In fact, certain categories have even seen a decline in their overall price level. The prices for energy and transportation services are down 8% and 5%, respectively, from the prior year. In this Asset Allocation Weekly, we will discuss the impact monetary expansion has had on consumer prices so far and what we expect going forward.
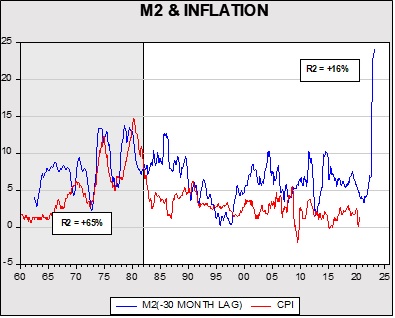
The correlation between the money supply and inflation has always been subject to dispute. The crux of the debate is based on whether one believes the velocity of money, which is output divided by the money supply, is constant. If velocity is constant, then inflation is caused whenever the growth of the money supply outpaces the growth in goods and services produced. However, if velocity is not constant, then the impact that the money supply has on inflation is ambiguous at best.
When Milton Friedman made his comments in 1970, there was some evidence that inflation and money supply were highly correlated, albeit at a nearly three-year lag. Nevertheless, this correlation began to break down in the mid-1980s as 1) financial deregulation made it harder to determine whether households were saving for future spending or for other reasons (e.g., holding cash as an asset), and 2) globalization and deregulation flattened the aggregate supply curve, changing the impact of rising aggregate demand on price levels. As a result, the money supply became more volatile over time as goods, commodities specifically, became a less important factor in determining inflation.[1] Hence, volatility became less stable over time, thereby breaking the direct link between inflation and the money supply.
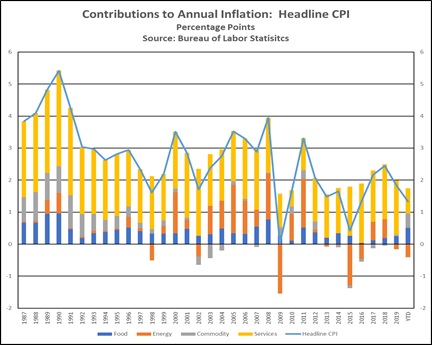
This pandemic was not an exception to this dynamic as disinflation ensued in the face of an unprecedented amount of fiscal and monetary stimulus. So far, CPI has risen at an annualized rate of 1.77%, down from the previous year’s rate of 2.85%. The primary drag on inflation is coming from the energy and services sectors, which have both been adversely impacted by the pandemic. Energy prices are down nearly 8% from the prior year, while services, which is the primary driver of inflation, has slowed from an annual rise of 3.1% in February to 1.9% in September. That being said, the stimulus may have supported stronger commodity prices as demand for vehicles has surged. Used cars, in particular, benefited from the stimulus as prices rose 10% from the prior year.[2]
Furthermore, the likelihood of runaway inflation similar to what we saw in the 1970s and early 1980s is slim. Imported goods from abroad will likely prevent food and commodity prices from rising substantially, while prices for services will likely remain low as owners seek to recover their losses and attract customers. The biggest threats to inflation are more likely to come from a weaker dollar resulting in higher import prices and a change in regulation that constrains imports or productive capacity.
In summary, inflation is unlikely to reach the heights seen during the 1970s and early 1980s as the link between the money supply and inflation has been broken for quite some time. A weaker dollar and sudden changes to government regulation are probably bigger inflationary risks. In the meantime, we suspect that stable inflation will likely support stronger performance of financial assets, especially equities compared to bonds. Residential real estate could also benefit.
Commercial crude oil inventories fell 8.0 mb when a 2.0 mb build was expected. The SPR declined 0.2 mb; since peaking at 656.1 mb in July, the SPR has drawn 16.7 mb. Given levels in April, we expect that another 5.7 mb will be withdrawn as this oil was placed in the SPR for temporary storage. Taking the SPR into account, storage fell 8.2 mb. The data was affected by tropical activity again this week as Hurricane Zeta disrupted oil flows.
In the details, U.S. crude oil production fell 0.6 mbpd to 10.5 mbpd. Exports fell 1.2 mbpd, while imports declined 0.6 mbpd. Refining activity rose 0.7%. Tropical activity continues, with Tropical Storm Eta expected to pass over Cuba this weekend. Although we expect the oil regions of the GoM to be unaffected, it will likely disrupt shipping, thus affecting next week’s import and export data. We do expect tropical activity to wind down as we approach Thanksgiving.
(Sources: DOE, CIM)
The above chart shows the annual seasonal pattern for crude oil inventories. This week’s data showed a large decline in crude oil stockpiles, which is contraseasonal. Inventories are approaching their second seasonal peak. Thus, after next week, we would expect a steady slide in oil inventories.
Based on our oil inventory/price model, fair value is $45.43; using the euro/price model, fair value is $62.50. The combined model, a broader analysis of the oil price, generates a fair value of $53.20. The wide divergence continues between the EUR and oil inventory models. However, current oil prices are below all three measures of fair value, suggesting that oil prices are likely undervalued.
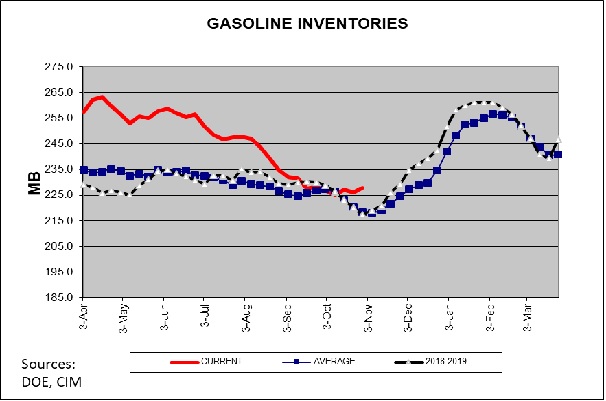
Gasoline inventories are approaching their autumn seasonal trough. Next week, the low is usually made and then stockpiles rise steadily into Valentine’s Day. This rise can be a bearish factor for crude oil prices as it has the potential to reduce refining margins.
(Sources: DOE, CIM)
As the energy world continues to think about reducing carbon output, the “once and future fuel,” hydrogen, is again making headlines. We first looked at hydrogen back in the 1990s when interest in fuel cells rose. There are some really attractive elements to hydrogen as a fuel. Fuel cells are nearly pollution-free. Hydrogen is a really light fuel and very efficient. But, creating hydrogen is an issue. There are generally two sources of hydrogen—water or a hydrocarbon (natural gas or coal). Separating the oxygen from the hydrogen from water takes a lot of energy, so if the energy is not “green,” the environmental improvement is much less. We would expect more interest on fuel cells and hydrogen in the coming years as countries try to figure out how to achieve a reduction in carbon emissions without crippling economic growth.
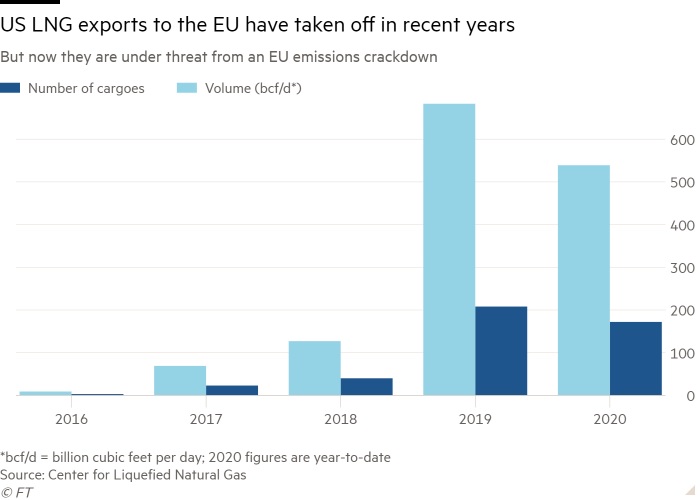
However, these flows are now facing increased scrutiny by European regulators. For years, natural gas was seen as the “good fuel”; its carbon footprint is less than coal or oil. But, methane leaks from natural gas wells are common and methane is a potent greenhouse gas. Accordingly, EU regulators are closely examining the impact from LNG and thus exports are at risk. France has actually moved to ban U.S. LNG due to the lack of well head methane control. The U.S. is arguing against France’s decision and we await any trade retaliation. If the pressure continues, we would expect U.S. natural gas firms to take additional steps to control well leakages to win back EU business.
Japan announced it intends to be carbon neutral by 2050. The narrative is that Japan will achieve this goal through solar and wind. We suspect it will have to take another look at nuclear if this goal is to be achieved. Japan has been replacing nuclear capacity with coal due to the Fukushima disaster but maintaining that trend and meeting this carbon goal are incompatible.
In our WEU report from October 16, we noted that energy stocks are underperforming not only overall equities but even crude oil prices. Part of the reason for this divergence has been that energy scores low on ESG—Environment, Social, and Governance—investing. Although we take a rather dim view of ESG,[1] there is no doubt the investing style has become quite popular. It is very possible that the underperformance of energy stocks is tied to the onset of ESG investing. In response, the Energy sector is looking to improve its ESG profile. For example, Baker-Hughes (BKR, USD 15.32) announced it will be Compact Carbon Capture, a privately held firm engaged in, well, what its name says. Although carbon capture technology is relatively new, it could be critical to maintaining climate stability. The fact that energy companies are investing in the technology suggests they are taking account of climate change.
Another problem? Although shale oil production has clearly led to a rapid rise in U.S. oil production, it has done so with little benefit to investors. The industry has tended to consume capital and has mostly survived in a low interest rate environment. The remaining firms are now seeking to improve their position with Wall Street, mostly through mergers. It remains to be seen if the industry can return to favor among investors.
It’s now been more than a quarter century since the first nefarious behavior was observed on the internet. There have been countless news reports about computer hacks, stolen data, ransom scams, misinformation aimed at manipulating elections, and the like. Many of us have had to change our passwords and sign up for free credit monitoring after a service provider suffered a digital breach. We’ve probably all seen how businesses have been forced to up their game and adopt stronger computer security, just like they lock their doors against common burglars.
But what if common burglars aren’t necessarily the best model for thinking about hackers? Some of the hackers who threaten our personal data or the sensitive systems of our companies and public institutions certainly are “lone wolves,” but in this report, we’ll show that another model for understanding today’s hackers can be found in the pirates who prowled the Spanish Main from the 1500s to the 1700s. We’ll look at what some hackers have in common with those pirates and what it means for digital security. As always, we’ll wrap up with a discussion of potential investment ramifications.
We use cookies to ensure that we give you the best experience on our website. If you continue to use this site we will assume that you are happy with it.Accept