When talking about international relations, it’s tempting to describe each country as a monolithic, rational decisionmaker with a settled set of concerns, goals, strategies, and tactics. Examples of such descriptions include: China wants to solidify its claim to the South China Sea; Russia is trying to undermine Western democracies; and the U.S. has tired of global hegemony. This convenient shorthand makes it easier to talk about geopolitics, but it can mask the reality that a country’s behavior is driven by the decisions and initiatives of powerful individuals. Those decisions and initiatives may reflect the country’s traditional perspectives, lessons from history, and habits developed over centuries. They may incorporate today’s popular opinion or the preferences of the ruling classes. But a country’s policies still reflect the decisions of individuals in power as constrained by their personal, political, and bureaucratic environment. Without Napoleon, it’s unlikely that post-revolutionary France would have embarked on its aggression against the rest of Europe in the way that it did. Without Adolf Hitler, neither would post-World War I Germany have done so.
If leaders and leadership really do count, a good example today is Turkish President Recep Tayyip Erdoğan and the way he’s deploying Turkey’s power in Asia Minor. In Part I of this report, we provide a deep dive into Erdoğan’s perspectives, goals, power, initiatives, and constraints. Next week, in Part II, we’ll show how Erdoğan is trying to make Turkey a player in the newly discovered, rich natural gas fields of the Eastern Mediterranean. Since that initiative could lead to a confrontation with other countries, Part II will also explore the potential implications for investors.
For more than a decade, U.S. investors who diversified their risk assets to include foreign equities have been sorely disappointed in the results. Since September 2010, for example, the S&P 500 Index of large cap U.S. stocks has provided an average annual total return of approximately 13.9%, but the MSCI ACWI ex-U.S. Index of foreign stocks has provided a total return averaging just 4.6%. At those rates of return, an all-U.S. stock portfolio would have doubled in value every 5.2 years or so, whereas an all-foreign stock portfolio would have taken about 15.7 years to double. Even a broad index of U.S. corporate bonds would have beaten the broad foreign stock market over the last decade, with only about one-third as much volatility! It should be no wonder that many investors have chosen to exclude foreign stocks from their portfolios.
But if you understand the key drivers behind the U.S. outperformance and foreign underperformance in recent years, it can clarify your thinking about the proper asset allocation strategy for the coming years. As we’ve argued repeatedly, much of the difference in U.S. versus foreign stock returns can be traced to the foreign exchange value of the U.S. dollar. When the greenback is strong and appreciating, the broad U.S. stock indexes tend to show better returns than the foreign indexes. Indeed, the dollar was generally rising from mid-2011 to mid-2020, explaining much of the U.S. outperformance over the last decade. In contrast, when the greenback is weak and falling, foreign indexes tend to outperform. That’s important because it appears the dollar has recently rolled over and begun what could well be an extended slide. If so, the coming period is likely to strongly favor foreign stocks.
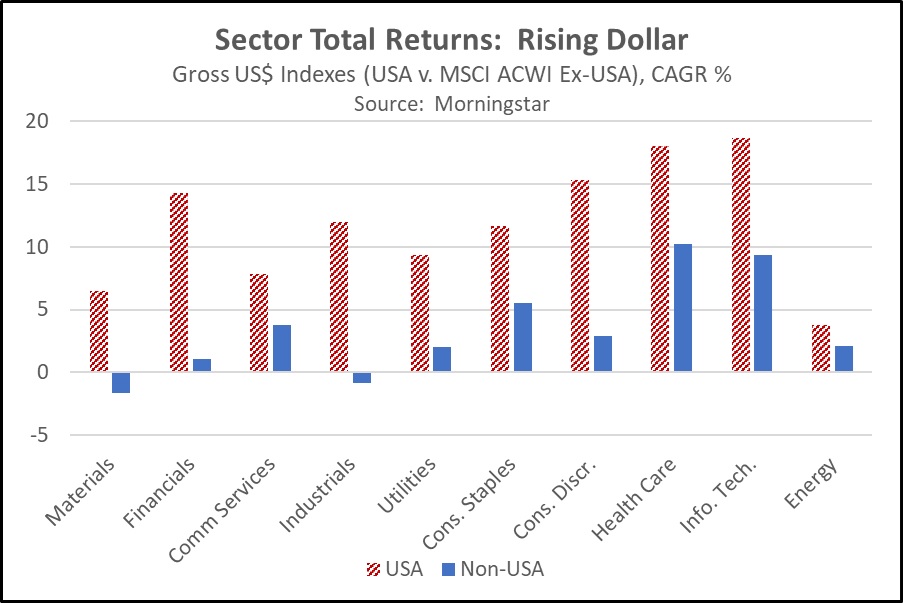
Of course, some of the recent outperformance of U.S. stocks simply reflects the preponderance of large cap Technology and Health Care names in the U.S. indexes. Those stocks have been particularly in vogue and have shown extraordinary growth in recent years. Nevertheless, taking a deeper dive into the relative performance of U.S. and foreign stock market sectors shows that the strength of the dollar is the predominant factor. If foreign stocks outperform U.S. stocks across a wide variety of sectors during a weak-dollar period, it should help confirm that the relationship is the most useful guidepost, and that is indeed what the data shows. This can be seen by examining the first chart below, which shows the outperformance of U.S. stocks (represented by striped red columns) versus foreign stocks (solid blue columns) over the last two strong-dollar periods from May 1995 to February 2002 and from May 2011 to July 2020. During these periods, U.S. total returns roundly beat foreign stock returns in all sectors for which comparable data was available (the data exclude real estate).
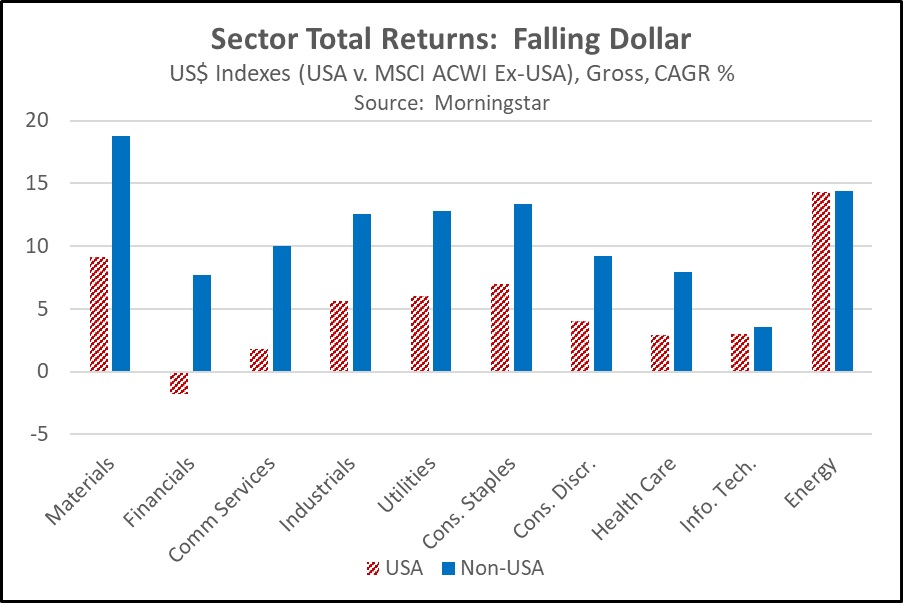
In contrast, the chart below shows how dramatically foreign stocks turned the tables during the period of dollar weakness from February 2002 to May 2011. In this period, foreign stocks handily beat U.S. returns in almost all sectors. The sectors are shown, from left to right, in the order by which the foreign returns beat the U.S. returns. The graph clearly demonstrates how dramatically foreign Materials, Financials, Communication Services, and Industrials stocks outperformed their U.S. counterparts as the dollar declined. Given the significantly greater exposure to Materials, Financials, and Industrials in the foreign indexes, those sectors account for most of the overall foreign outperformance during the weak-dollar period. In the high-growth Information Technology and Health Care sectors, foreign stocks also outperformed their U.S. counterparts as the dollar declined, but the relative underrepresentation of those stocks abroad kept the foreign outperformance smaller than it otherwise would have been.
Although the data set used in this study only began in 1995, covering just two rising-dollar periods and one falling-dollar period, the relationships described above make logical sense. For example, a low or falling dollar tends to support commodity prices, so foreign Materials firms should see improved finances when the greenback is sliding. Our analysis also indicates that foreign emerging market stocks have an even more pronounced advantage in a falling-dollar phase. In sum, the analysis indicates that if the dollar is indeed falling into a prolonged downtrend like we think, the new investment environment is likely to favor a wide swath of foreign equities in the coming years.
The business cycle has a major impact on financial markets; recessions usually accompany bear markets in equities. The intention of this report is to keep our readers apprised of the potential for recession, updated on a monthly basis. Although it isn’t the final word on our views about recession, it is part of our process in signaling the potential for a downturn.
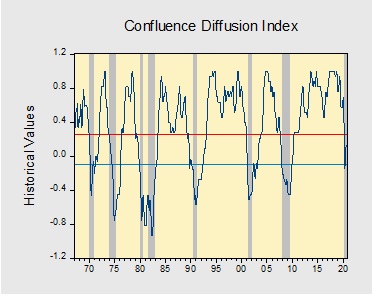
In August, the diffusion index rose further above contraction territory, signaling that the economy remains on track to expand in Q3. Financial markets were sending positive signals as equities surged, while the yield curve steepened. Meanwhile, the labor market continues to show signs of improvement as hires continue to surpass the pre-pandemic high. Markets responded positively to news regarding the stage of development of various vaccines. However, the lack of progress on additional fiscal stimulus continues to weigh on growth expectations as concerns over slowing consumer spending continue to mount. As a result, five out of the 11 indicators are in contraction territory. The reading for August rose from 0.0303 to 0.0909, above the recovery signal of -0.100.
The chart above shows the Confluence Diffusion Index. It uses a three-month moving average of 11 leading indicators to track the state of the business cycle. The red line signals when the business cycle is headed toward a contraction, while the blue line signals when the business cycle is headed toward a recovery. On average, the diffusion index is currently providing about six months of lead time for a contraction and five months of lead time for a recovery. Continue reading for a more in-depth understanding of how the indicators are performing and refer to our Glossary of Charts at the back of this report for a description of each chart and what it measures. A chart title listed in red indicates that indicator is signaling recession.
by Bill O’Grady, Thomas Wash, and Patrick Fearon-Hernandez, CFA | PDF
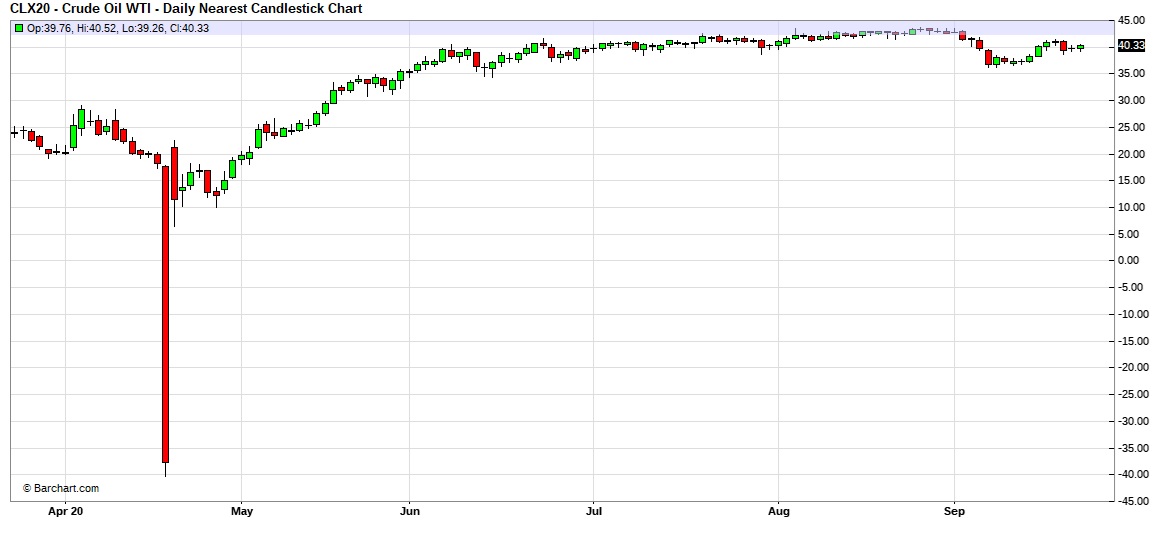
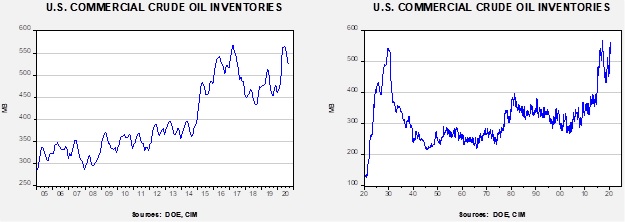
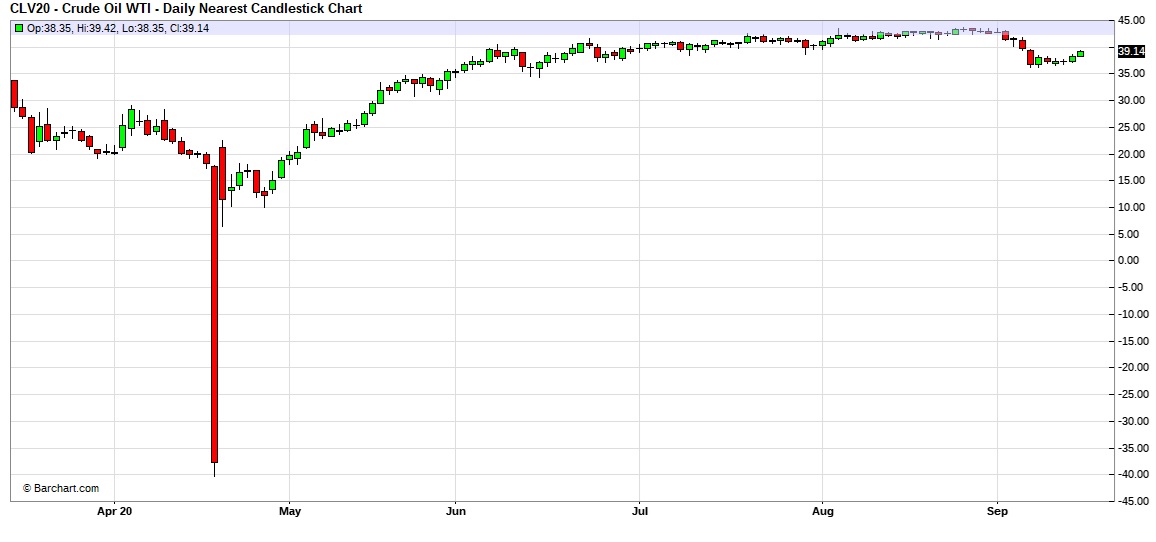
Here is an updated crude oil price chart. The recent dip in prices remains, although we are seeing some recovery.
(Source: Barchart.com)
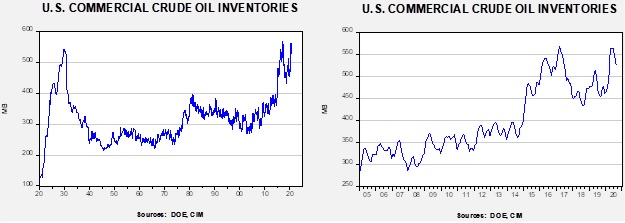
Crude oil inventories fell a bit less than expected. Commercial stockpiles declined 1.6 mb compared to forecasts of a 2.8 mb decline. The SPR declined 0.8 mb; since peaking at 656.1 mb in July, the SPR has drawn 11.0 mb. Given levels in April, we expect that another 10.1 mb will be withdrawn as this oil was placed in the SPR for temporary storage. Taking the SPR into account, storage fell 2.4 mb.
In the details, U.S. crude oil production fell 0.2 mbpd to 10.7 mbpd. Exports rose 0.4 mbpd, while imports rose 0.2 mbpd. Refining activity fell 1.0%.
(Sources: DOE, CIM)
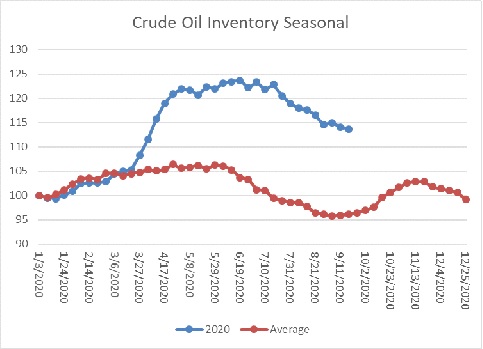
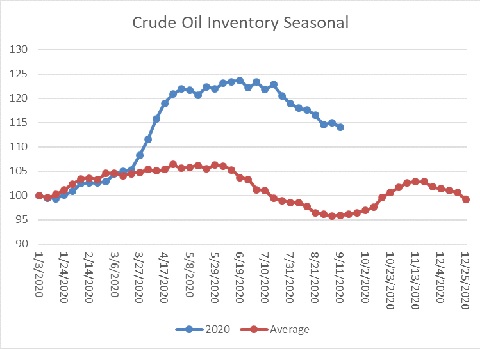
The above chart shows the annual seasonal pattern for crude oil inventories. This week’s data showed a decline in crude oil stockpiles, which is contra-seasonal. Inventories tend to make their second seasonal peak in the coming weeks. Tropical activity has been elevated this year and has distorted the data; we won’t get a really clear picture of oil flows for a few weeks.
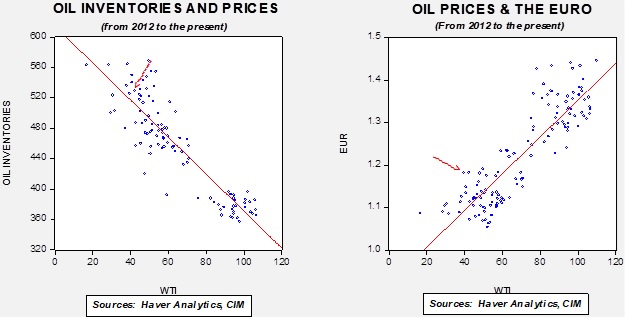
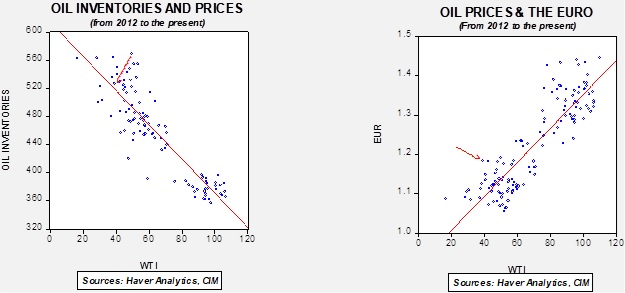
Based on our oil inventory/price model, fair value is $42.25; using the euro/price model, fair value is $63.79. The combined model, a broader analysis of the oil price, generates a fair value of $52.57. The wide divergence continues between the EUR and oil inventory models. As the trend in the dollar rolls over, it is bullish for crude oil. Any supportive news on reducing the inventory overhang could be very bullish for crude oil.
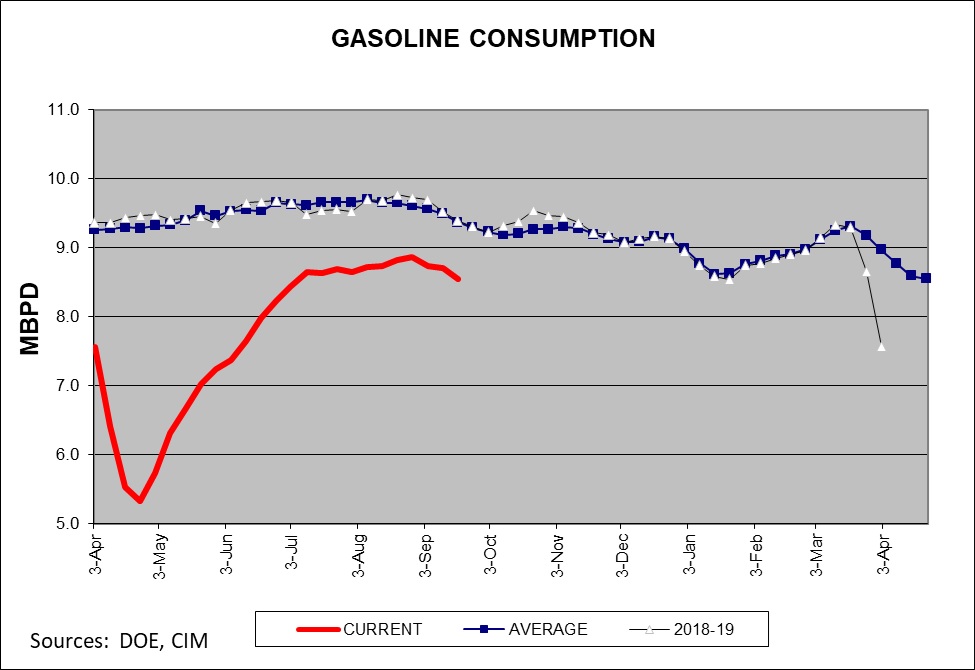
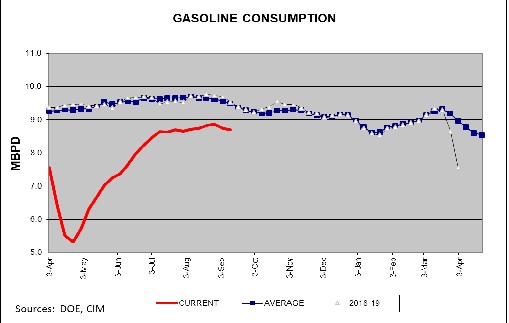
Gasoline consumption fell a bit this week. Seasonally, this is normal. Driving tends to slow as vacation season ends. As the chart shows, consumption declines slowly into mid-January. This year may be different; if a vaccine is developed that increases commuting then we could see driving levels rise, but without that result we should expect overall demand to fall through Q4.
As we noted last week, the most potent bearish factor for oil prices has been weak demand. The response to the pandemic has led to a sharp drop in consumption around the world. The uneven path of the virus spread has made demand forecasting especially difficult. In general, as the virus situation improves, we should see demand improve. However, the recovery has been slow, especially since emerging markets seem to be the source of much of the slide in consumption. Emerging market economies tend to use more oil per unit of GDP because their economies lean toward goods production. Thus, economic weakness in this sector of the world economy tends to have a disproportionate impact on oil demand. In the long run, rising concern about climate issues is a bearish demand factor for oil. The Business Roundtable’s recent call for carbon pricing, a harbinger for a carbon tax, shows that business leaders are moving on this issue even if the political leadership remains divided. The industry is starting to grapple with the idea of peak oil demand; managing contraction is very difficult. Although the timing of the drop is difficult to discern, the likelihood that demand will fall over time is rising. One of the worries is that if oil reserve owners conclude they are holding a wasting asset, there will be a drive to “dump” their asset at any price. One technology that could save the oil industry is carbon capture. Large oil companies are funding research but, so far, no commercially viable technology has emerged. Given the level of CO2 in the atmosphere already, carbon capture may be necessary even if we reduce oil consumption.
At this week’s U.N. video gathering on the 75th anniversary of the founding of the body, General Secretary Xi said his country would achieve “carbon neutrality” by 2060. National promises on such issues are easy to make but hard to achieve. And, that promise will certainly not be fulfilled in Xi’s lifetime. Nevertheless, if the CPC is serious on this issue, it is bad for the oil demand outlook. Interestingly enough, we doubt this is achievable without a serious expansion of nuclear energy. Nuclear energy has become nearly impossible in the developed world, but it very well could expand in authoritarian China.
This isn’t to say that supply hasn’t played a role in keeping prices depressed; Saudi Arabia is calling out OPEC members who are exceeding quota. Unfortunately, short of triggering another price collapse, there is little the kingdom can do to force compliance.
In Libya, which is in the midst of a civil war, it appears the current oil blockade is going to be lifted. Although this action could increase global oil supplies, in reality, the situation in Libya is so unstable that any flows will likely be intermittent.
Meanwhile, financing conditions in the U.S. oil patch remain perilous. Bankruptcies are rising and companies continue to outspend their revenue, a condition that can only continue with a steady source of funding. One area that has seen a reversal for fortune is the Permian. The lack of pipeline capacity pre-pandemic was a constant problem, leading to wide price differentials as producers faced bottlenecks in getting their oil to refiners. Now they have the opposite problem; the industry responded by building takeaway capacity, only to find now there is more pipeline capacity than production.
The Nord Stream 2 project that will take natural gas directly to Germany has been a point of contention between Washington and Berlin for years. The pipeline is very close to completion and elements within Germany and Russia want to see it finished. The pipeline purposely avoids Ukraine; in the past, when Russia and Ukraine have had issues, Russia would often close or curtail natural gas supplies which would reduce gas to much of Europe. This new pipeline is designed to avoid this problem. The U.S. isn’t fond of Nord Stream 2 because it gives Russia leverage over Germany, so American administrations have consistently tried to get Germany to abandon the project. The recent poisoning of Alexei Navalny increased calls for Germany to scotch the pipeline. Instead, Berlin is offering to support the construction of two new LNG terminals in return for allowing the pipeline to be completed. The idea is that these facilities would allow the U.S. to also supply Germany with natural gas. Therefore, despite everything, it does appear the pipeline will be finished.
Because of Japan’s enormous role in the world, investors need to pay attention whenever the country undergoes a change of leadership as it did last week. After all, Japan currently accounts for some 7% of global stock market capitalization and 6% of the world’s gross domestic product. Not bad for a country whose 126 million people make up just 1.7% of the world’s population! Japan is also a key U.S. ally in the military and diplomatic spheres. It hosts huge U.S. military bases, allowing the U.S. to mount a robust “forward defense” in the Western Pacific, and it’s a vital partner in countering aggression from nations like China and North Korea. With its stable, vibrant democracy and dynamic consumer culture, Japan is a natural partner for the U.S. in East Asia.
But who is Japan’s new prime minister? In this report, we’ll sketch out the biography of Yoshihide Suga and examine how he’s likely to govern in the years ahead. We’ll focus especially on his probable policies in the areas of diplomacy, defense, economics, and finance, and we’ll discuss how effective he might be as a leader. As always, we’ll wrap up with a discussion of what the new prime minister might mean for investors.
In June, we published a WGR on the EU’s decision to issue a Eurobond, a financial instrument backed by the full faith and credit of all the member states of the European Union. One of the reasons the U.S. dollar remains the global reserve currency is because the world financial system works on a dollar/Treasury standard. The U.S. has open trade and capital markets. Because of America’s willingness to accept persistent trade deficits, foreign countries can acquire dollars through trade and easily hold those dollars in reserve in the deep American financial markets. The premier reserve instrument has been the U.S. Treasury; in fact, it could be argued that the Treasury is America’s greatest export product.
The attractiveness of the dollar as a reserve instrument is relative; American management of the reserve currency is far from ideal. When the world shifted from the dollar/gold to dollar/Treasury, Europeans complained that the U.S. was exporting inflation through a weaker currency. Treasury Secretary Connally noted that the dollar “is our currency but it’s your problem.” Volcker’s anti-inflation policies of the early 1980s was a major contributor to the Latin American debt crisis and the “lost decade” of the 1980s for South America. Since 9/11, the U.S. has used financial sanctions as a foreign policy tool. Restricting access to the U.S. financial system has proven to be very effective in crippling foreign economies.[1] But, these sanctions are not popular with foreign governments. Dissatisfaction with dollar management has not reached a level adequate to overcome the network effects that keep the dollar as the reserve asset.
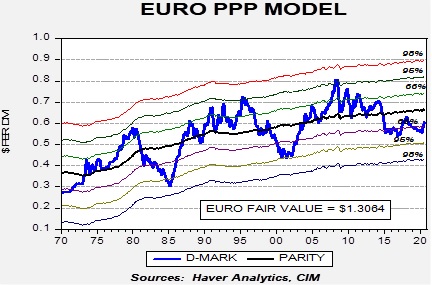
It is important to note that we view the introduction of a Eurobond as a catalyst for a change in trend but the primary reason for a new dollar bear market is valuation. Against most major currencies, the dollar is deeply overvalued.
Our primary valuation model for currencies is purchasing power parity. This model uses relative inflation to value currencies. It is not a trading model; exchange rates tend to vacillate around the forecast parity level. But, at extremes, it can signal that the exchange rate is vulnerable to a reversal. In general, dollar bull markets tend to end with a catalyst. The 1970s dollar bear market began with the closing of the gold window. The 1985 bull market ended with the Plaza Accord. The 2002 trend reversal began with statements pressing for a weaker dollar from the U.S. Treasury secretary. As is true of many markets, valuation alone doesn’t cause reversals, but it creates conditions where a reversal is more likely.
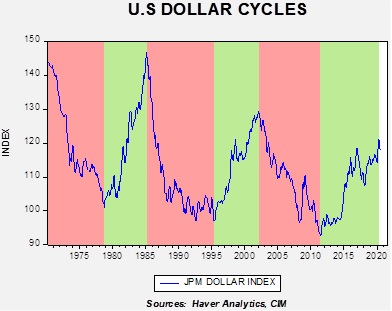
Perhaps another way of thinking about the dollar is that the exchange rate creates winners and losers. A strong dollar adversely affects exporters and industries that compete with imports. It supports importers and solely domestic industries. A weak dollar has the opposite impact. Thus, over time, when a sector is harmed a political reaction will follow which leads to a reversal in trend. With the dollar, the cycles tend to be long, meaning that the level needs to be extreme to trigger a policy response.
This chart shows the JP Morgan Dollar Index, which is adjusted for inflation and is trade weighted.[2] Bull markets are colored in green, and bear markets in mauve. For a U.S. dollar investor, the path of the dollar’s exchange rate is a critical component of foreign investing.
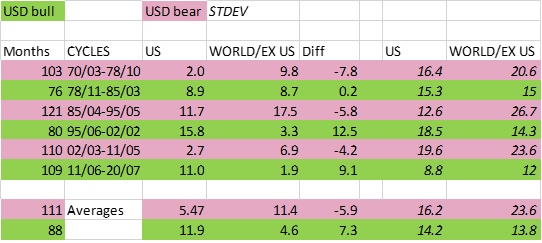
This table uses the dollar cycle dates and compares the MSCI U.S. Index with the MSCI World ex-U.S. Index. We use the yearly change in monthly data, averaged over each cycle. On average, the latter index outperforms the U.S. in dollar bear markets, whereas the U.S. outperforms during dollar bull markets. There are two other characteristics of note. First, cycles last a while; the average dollar bear market lasts 111 months (just over nine years) and dollar bull markets last 88 months (eight years). Second, dollar bear markets tend to have higher levels of volatility.
If our postulate is correct and the dollar is about to enter a bear market, the outlook for foreign stocks relative to domestic stocks improves. Although there is no certainty that our position is correct, the combination of an overvalued currency, a lengthy bull market, and a Eurobond catalyst increases the odds that a reversal is likely. If so, the outlook for foreign equities should improve.
by Bill O’Grady, Thomas Wash, and Patrick Fearon-Hernandez, CFA | PDF
Here is an updated crude oil price chart. The recent dip in prices remains, although we are seeing some recovery.
(Source: Barchart.com)
Crude oil inventories fell when a rise was expected. Commercial stockpiles declined 4.4 mb compared to forecasts of a 2.3 mb rise. The SPR declined 2.1 mb; since peaking at 656.1 mb in July, the SPR has drawn 10.2 mb. Given levels in April, we expect that another 10.9 mb will be withdrawn as this oil was placed in the SPR for temporary storage. Taking the SPR into account, storage fell 6.5 mb.
In the details, U.S. crude oil production rose 0.9 mbpd to 10.9 mbpd. Exports fell 0.3 mbpd, while imports rose 0.4 mbpd. Refining activity rose 4.0%.
(Sources: DOE, CIM)
The above chart shows the annual seasonal pattern for crude oil inventories. This week’s data showed a decline in crude oil stockpiles. We are starting the seasonal build period. Stockpiles remain well above seasonal norms and remain a bearish factor.
Based on our oil inventory/price model, fair value is $41.27; using the euro/price model, fair value is $64.17. The combined model, a broader analysis of the oil price, generates a fair value of $52.47. The wide divergence continues between the EUR and oil inventory models. As the trend in the dollar rolls over, it is bullish for crude oil. Any supportive news on reducing the inventory overhang could be very bullish for crude oil.
Gasoline consumption fell a bit this week. Seasonally, this is normal. Driving tends to slow as vacation season ends. As the chart shows, consumption declines slowly into mid-January. This year may be different; if a vaccine is developed that increases commuting then we could see driving rise, but without that result we should expect overall demand to fall through Q4.
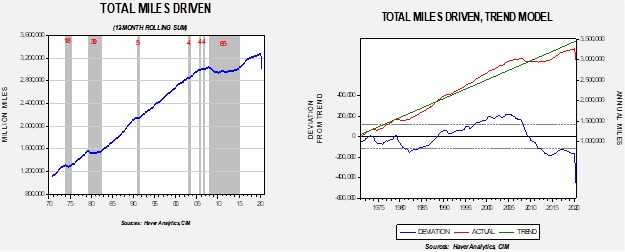
On a long-term basis, we are seeing a profound decline in miles driven. This dovetails into the discussion below on peak oil demand.
The chart on the left shows miles driven on a rolling 12-month basis. The gray bars indicate periods when the number didn’t make a new high. There were three periods of significant stalls in driving activity. The first two were a combination of recession and high oil prices. The last one was mostly due to the Great Financial Crisis, although the high oil prices in 2008 did play a minor role. Of course, the pandemic has caused a steep decline. The chart on the right shows a simple trend model. Driving fell below-trend in 2009 and has remained below-trend ever since. This decline in driving is part of the peak oil discussion.
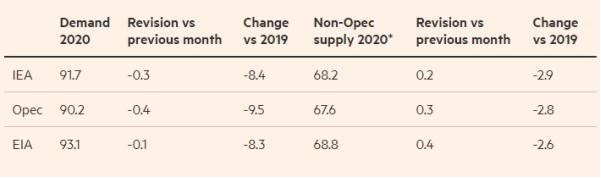
This was the week of peak oil demand, and a number of sources, including BP (BP, 19.66), are warning that the world may be close to the maximum of oil consumption. Continued electrification of transportation and improved consumption efficiency in oil use are the primary factors in bringing the peak. Meanwhile, for this and next year, major data providers, including OPEC, are projecting weaker than previously forecast consumption.
(Source: FT)
As we have noted in earlier reports, the Trump administration has been caught between two constituencies, farmers and the oil industry. The former wants to force the refining industry to meet the goals set by the EPA for biofuel consumption. The latter wants to avoid them. For the most part, the administration has been granting waivers to refiners to allow them to use less biofuels than mandated. The administration has decided to void exemptions to small refiners; electorally, this decision boosts Iowa at the expense of Texas.
We use cookies to ensure that we give you the best experience on our website. If you continue to use this site we will assume that you are happy with it.