Keller Quarterly (October 2020)

Letter to Investors | PDF

Every four years, investors contemplate the upcoming presidential election and begin to worry in earnest that it will turn their world upside down.  I hear from clients that their financial plans will all come crashing down if the “wrong” person is elected.  Now, I realize that elections have consequences, and that many of those consequences are very important, even if they have little or nothing to do with your investment plans.  Yet, it is my experience that most of us tend to overestimate the impact of presidential elections on our investment portfolios, often by a lot.  While the upcoming election, like all presidential elections, is indeed momentous, and while the level of partisanship in America is at the highest decibel-level I’ve heard in many decades, I am rather optimistic for the stock market over the next several years for four reasons.

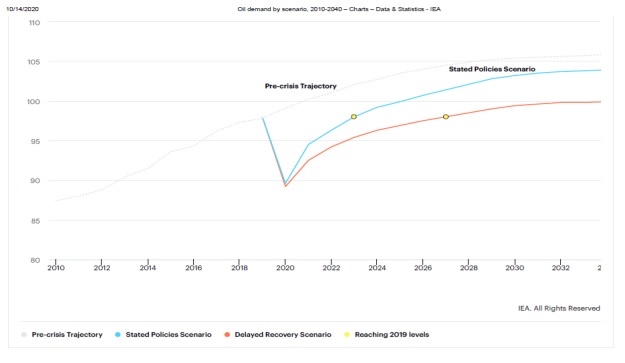
First, the American economy is now in recovery, having just experienced a recession.  Our economists believe that the U.S. economy peaked and began to decline last February, but, in one of the shortest recessions on record, it appears to have hit bottom in July and is now on the way back up.  The economy will likely take up to two years to exceed its pre-recession level of output, but it is obvious to us that it is now moving in a positive direction.  There is rarely a better time to be an equity investor than during a recovery.  While there is plenty of negative news during such a time (especially about employment, a lagging indicator), the market climbs its “wall of worry” during precisely such a time.  This recession (due to pandemic) would have occurred regardless of who was in the White House, and I believe it will also recover regardless of who calls 1600 Pennsylvania Avenue home.

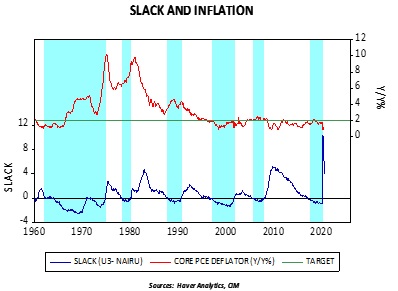
Second, the Fed is taking extraordinary action to support the U.S. financial system.  As we saw in 2008, recessions turn into Great Recessions when economic troubles trigger collapses in the financial system.  Such collapses almost always result from policy errors made by key financial system regulators, and we saw several such errors in the summer and fall of 2008.  Regarding 2020, a wise friend recently said to me, “It’s as if the Powell Fed read the history of 2008 and was determined not to make any of those mistakes.”  Many are worried that such Fed policies will produce inflation.  We heard this 12 years ago also.  But, in the context of our current economic state, especially enormous globalization, high inflation of goods prices is unlikely.  Instead, like the aftermath of 2008, we are more likely to see inflation of asset prices, especially financial assets such as equities.

Third, the lethality of COVID-19 is likely to subside and come under control over the next two years.  I say this not as a medical expert, but as an observer of past epidemics.  Viral pandemics run their course due to mutation, to herd immunity, and, in the modern world, to effective medical weaponry such as vaccines and anti-virals.  In fact, we are already seeing lower mortality around the world.  Since the economic recession was induced by this virus, its almost certain subsidence should bring increasing economic activity, which is good for stock prices.

The problems noted above rose and began to fall with no regard to whom the president was.  This is not unusual.  This is how most cyclical bear markets in stocks begin and end.  Our noisy political news environment would like you to believe that everything bad that happens, from recessions to hurricanes, and everything good that happens, from booming economies to beautiful spring days, occur because of who is in the White House.  One of the most important lessons to be learned in investing is that almost none of that is true.  And, right now, the above three trends are moving positively regardless of political activity.

I said there was a fourth positive factor: soon the presidential election will be behind us.  I’m not being facetious.  After all the yelling and screaming is over, the nation’s attention will go back to work again.  Now, I’m aware that this year there is a heightened potential for not having a result on election night, primarily (again) due to the pandemic.  As in November 2000, this scenario would probably frighten the markets and lead to a short-term sell-off in stock prices, a decline that would probably continue until a result is achieved.  Once achieved, the positive factors noted above (recovering economy, supportive Fed, and subsiding pandemic) would likely immediately command the market’s attention and, in my opinion, the cyclical recovery in stocks would resume.

The above opinions are not borne from “cock-eyed” optimism, but from decades of observations of both economic and presidential cycles.  The stock market is neither Republican nor Democrat but is solely interested in making money.  In my opinion, the current environment is well-suited to doing just that, regardless of who wins the election.

We appreciate your confidence in us.


Gratefully,

Mark A. Keller, CFA
CEO and Chief Investment Officer

View PDF

Asset Allocation Quarterly (Fourth Quarter 2020)

by the Asset Allocation Committee | PDF

  • We believe that we are now in an economic recovery which we expect to be long and slow moving.
  • The Federal Reserve will likely continue to be aggressively accommodative, as will other global central banks, providing a favorable backdrop for equities.
  • With an accommodative Fed, we retain elevated relative weightings to equities, yet exposures in the strategies have shifted toward an emphasis on cyclical stocks.
  • Given the upcoming U.S. elections and the accompanying uncertainty of policies in its wake, we initiated a position in non-U.S. equities. Their favorable valuations and the potential for a softening in the exchange rate for the U.S. dollar make them attractive for U.S.-based investors.
  • Exposure to gold is retained in each of the strategies given its ability to act as a hedge against geopolitical risks and for its appreciation potential due to global central bank accommodation and in the event of a decline in the exchange rate of the U.S. dollar.

ECONOMIC VIEWPOINTS

Although the upcoming U.S. elections have captured extraordinary attention, whether the nation swings red, blue, or purple is of nominal consequence to equity and debt markets beyond near-term swings. Rather, our forecast rests upon the principal pillar that the U.S. has now entered a recovery, albeit a long and protracted one. We are expecting a sizable bounce in the Q3 GDP print off the jarring Q2 number, followed by low yet steady growth. While a number of publications have offered alphabetic depictions of the economy, such as V-shaped, U-shaped, W-shaped, and L-shaped, our view is that it will resemble a square root sign. The aggressive accommodation by the Fed will be helpful, as will any further fiscal stimulus measures. The Fed’s pronouncement following its virtual Jackson Hole meeting at the end of August that it will unbind its hard 2% inflation target in favor of attempting to average this level over time is a marked change, yet will likely have no perceptible impact within our three-year forecast period. Similarly, the Fed has stated its intention of no longer using low unemployment as an indicator of potential inflation. As the accompanying chart illustrates, the level of slack in labor had been useful as a gauge of inflation last century but has been of spurious utility over the past 25 years. While these two policy changes are noteworthy, we find the likelihood for the Fed to engage in a form of yield curve control and leave fed fund rates mired near the zero bound through next year and potentially beyond to be of greater consequence and should be supportive of the economy and markets.

A near-term risk to the stock market is the potential for a presidential election where there is no clear winner. This could cause a significant, though short-term, negative event. Although we believe that over our entire forecast period the support offered by the Fed and market sentiment will be positive for risk assets, our recognition of the possibility of market disruption over the next few months encourages our continued use of gold as well as the introduction of non-U.S. developed market equities and long-term Treasuries, where risk appropriate, to serve as a partial containment for this scenario.

Looking beyond the U.S., global economic indicators paint a similar portrait to that of the U.S., as one would expect given the reach of COVID-19. The recently released World Economic Outlook by the IMF provided modestly improved expectations for global growth, though unevenly applied. As examples, China is certainly ahead of the rest of the world in terms of the dynamics brought about by COVID-19 and could be the sole major economy that records positive growth this year, the EU and U.K. are potentially facing a hard Brexit at year-end which carry realignment implications, and the new Prime Minister in Japan is examining new methods to bring inflation to target and boost domestic consumption. Overall, however, the world appears to be recovering from the economic ravages of the disease and the forecast over the next three years is encouraging.

STOCK MARKET OUTLOOK

Although our forecast is for low, steady growth, we believe the Fed’s continual support will be positive for stocks. Some have accused the Fed of engaging in volatility suppression, and we see no change in direction at this juncture. With inflation dormant, household balance sheets being repaired, and consumer demand increasing, especially as we work through and beyond COVID-19, we anticipate attractive returns for stocks over our three-year forecast period. Over the next couple months, however, there is potential for volatility to spike should there not be a clear victor in the U.S. presidential election. Nevertheless, as we showed in the chart in last quarter’s edition of this publication, the longer-term return differential for  stocks between an incumbent Republican being reelected or a Democratic challenger being elected is marginal. Though there will be clear leaders and laggards among companies, industries, and sectors given changes in policies, the overall stock market is more affected by economic activity and monetary policy than by political victors.

Given our positive outlook, we remain relatively overweight equities. Within equities, however, we made several changes to geographic, sector, and industry exposures. The allocations to U.S. mid-cap equities were reduced in favor of introducing exposure to non-U.S. developed market stocks. Not only does this change shield against potential short-term volatility that could be created by a contested U.S. presidential election, but it also stands to benefit over our forecast period through the combination of attractive relative valuations and the potential for a weakening in the exchange rate of the U.S. dollar. The European Union’s proposed issuance of €750 billion in bonds to fund its COVID-19-related recovery program may be the catalyst that makes the euro a complementary currency, thereby ending the dollar’s ascendant cycle that has prevailed since the Great Financial Crisis. For U.S.-based investors, dollar weakness produces a very strong tailwind for returns on foreign stocks. This extends to emerging markets stocks as valuations are attractive and a resurgent Chinese economy holds enormous potential for other emerging markets that contribute to the global supply chain. The stimulus measures by the Chinese government adopted at the beginning of the summer are already having an effect and its economy is expected to exhibit positive growth in 2020.

Within the U.S., we emphasize cyclical stocks in the strategies and remove the tacit tilt toward growth. The sector overweights to Technology and Communication Services have been replaced by overweights to Industrials and Materials. The overweight to Consumer Discretionary that was introduced at the end of March remains. The strategies also have dedicated exposure to the housing sector. Our belief is that the strength of this segment will remain durable throughout the forecast period given the demographic demand.

BOND MARKET OUTLOOK

We expect the historically low yields and spreads on corporate bonds to prevail over the next three years as the Fed remains ultra-accommodative and supportive of the corporate bond market. Within that ultra-accommodative posture, we expect the Fed to exert a form of yield curve control, possibly out to the 10-Year maturity, as a form of financial repression. We further anticipate that the large-scale asset purchases of Treasuries and agencies will continue as a form of unlimited quantitative easing and that, as necessary, the Fed will backstop the corporate bond market, including some elements of speculative grade bonds. Consequently, spreads should remain close to current levels and could moderately tighten. As noted previously, comments by the Fed following its virtual Jackson Hole meeting are that it will no longer try to rein in inflation if it runs hot for several months and will not be utilizing low unemployment numbers as a harbinger of inflation. These policies are now established and will be followed regardless of the resident of the White House or the makeup of the legislature. Accordingly, we are likely to be range-bound over the course of our three-year forecast period. However, increasing debt issuance by the Treasury, agencies, and corporations could lead to oversupply and problems down the road for the Fed’s attempt to backstop the shadow banking system.

The strategies with income as an objective remain positioned with a laddered bond core and with exposure to agency mortgage-backed securities and a general overweight to corporate bonds. Although we believe the bond market will prove transcendent regarding the upcoming election, where it is risk appropriate, we have employed zero-coupon long-term Treasuries to provide a stabilizer over the next quarter in the event of elevated election-related equity market volatility.

OTHER MARKETS

As with the prior quarter, our expectations for REITs is that they will earn their dividend in the aggregate. Cell towers, data centers, and storage will offset weakness exhibited by the office/retail segment, which represents less than 20% of the REIT index. We maintain that REITs provide a varied and diversified source of income and are consequently utilized in strategies where income is a component.

Gold has been incorporated across all strategies since the fourth quarter of last year and continues to maintain a healthy allocation. It remains an important diversifier against heightened geopolitical risk and will benefit as central banks across the planet continue to be accommodative. Given the substantive move in silver last quarter, we elected to remove it from the more conservative strategies as its price appreciation caused the gold/silver ratio to move closer to its mean. However, we retain silver in strategies designed for growth as we believe it is risk appropriate and its industrial uses make it attractive in an economic recovery.

Read the full report

Weekly Geopolitical Report – The Election of 1876: Part I (October 19, 2020)

by Bill O’Grady | PDF

Earlier this year, in the spring, we issued a five-part series on the election.  At the time, we considered adding a section about a disputed outcome but decided that the odds of such a result were too low to consider.  Since issuing that report, the likelihood of an uncertain and disputed election has risen.  The combination of the president’s comments surrounding the insecurity of mail-in voting and the death of Justice Ginsburg has increased tensions dramatically.

Every election has at least some possibility for a disputed outcome.  However, despite the fact that we don’t have a national system for voting (beyond setting dates, individual states determine voting procedures), disputed elections are surprisingly rare.  There are two that offer historical parallels.  The Bush/Gore race in 2000 is probably familiar to most readers; the recount was ended by a Supreme Court decision which was reluctantly accepted by VP Gore.  The one that most readers probably aren’t as familiar with is the election of 1876, between Rutherford B. Hayes and Samuel J. Tilden.[1]  In many respects, the election of 1876 is perhaps a better historical analog to our current situation.

In this two-part report, we will begin by framing the 1876 election, focusing on the two issues that were dividing the country—reconstruction and the economy.  The personalities and positions of each candidate will be examined.  The election campaign and the election itself will follow.  We will conclude this section with a discussion of the elements of the dispute, the method of resolution, and the outcome.

Next week in Part II, using this background, we will employ the historian’s primary tool, compare and contrast.  There are similarities between the 1876 election and our current one, but there are important differences, too.  One of the critical differences is that in 1876 the U.S. “punched below its weight” in world affairs.  The government was preoccupied with the westward expansion and was more than happy to let the British run the world.  And so, being distracted by a disputed election didn’t mean all that much for world affairs.  That isn’t the case now, so we will discuss how various nations may use a period of uncertainty to further their geopolitical goals.  As always, we will close the report with potential market ramifications.

Read the full report


[1] The primary historical source for the election of 1876 is: Rehnquist, William. (2004). Centennial Crisis: The Disputed Election of 1876. New York, NY: Vintage Books, Random House Inc. (Kindle Edition).

Weekly Energy Update (October 16, 2020)

by Bill O’Grady, Thomas Wash, and Patrick Fearon-Hernandez, CFA | PDF

Here is an updated crude oil price chart.  Prices remain rangebound.

(Source: Barchart.com)

Commercial crude oil inventories fell 3.8 mb when a 2.0 mb decline was expected.  The SPR declined 1.2 mb; since peaking at 656.1 mb in July, the SPR has drawn 15.3 mb.  Given levels in April, we expect that another 6.7 mb will be withdrawn as this oil was placed in the SPR for temporary storage.  Taking the SPR into account, storage fell 5.0 mb.

In the details, U.S. crude oil production fell 0.5 mbpd to 10.5 mbpd.  Exports fell 0.5 mbpd, while imports declined 0.4 mbpd.  Refining activity fell 2.0%.  Hurricane Delta affected this week’s data.

(Sources: DOE, CIM)

The above chart shows the annual seasonal pattern for crude oil inventories.  This week’s data showed a small decline in crude oil stockpiles, which is contraseasonal.  Inventories tend to make their second seasonal peak about mid-November.  Tropical activity continues, which will affect the data for the next couple of weeks.

Based on our oil inventory/price model, fair value is $43.91; using the euro/price model, fair value is $62.27.  The combined model, a broader analysis of the oil price, generates a fair value of $52.27.  The wide divergence continues between the EUR and oil inventory models.  As the trend in the dollar rolls over, it is bullish for crude oil.  Any supportive news on reducing the inventory overhang could be very bullish for crude oil.

Hurricane activity has affected production, imports, and refining this season.  We are at the point, in a normal year, when refinery maintenance usually ends and product production increases.  If this develops this year, it should support crude oil prices in the coming weeks.

(Sources: DOE, CIM)

Refinery utilization is running well below normal due to the pandemic.  But we tend to track the seasonal pattern, which would argue for an increase in refining activity, which would lift crude oil demand.

The big news this week came from the IEA which released its World Energy Outlook for 2020.  Its forecast suggests that oil demand will peak around 104 mbpd by 2035, about 1.5 mbpd before the pre-pandemic estimate.  If the recovery ends up being slower than currently expected, due to delays surrounding treatment, the peak could occur sooner and be around 100 mbpd.  The delay scenario assumes that global GDP will not start to expand until 2023.  Even in the best scenario, global energy demand is facing its worst situation since the Great Depression.  The decline in air travel has played a role in the drop in demand.  Another reason for the depressed oil demand forecast is coming from the expansion of electric vehicles.  Europe is moving rapidly to force the adoption of battery powered cars.  The pandemic has also hastened the shift to renewables.  And, financing for oil projects appears to be becoming more difficult.  We note that the IEA report is generally in line with OPEC’s estimates.

(Source: IEA)

OPEC+ is facing a serious problem, even if President Trump is reelected.[1]  If a market for resources is facing extinction, the rational act would be to monetize the resource as quickly as possible.[2]  If the value of the resource is going to zero in the future, it makes sense to produce as much as possible in the short term before the “extinction date” arrives.  Although the Saudis are likely to signal that they will maintain output discipline for now, that may not hold in the future.  And for U.S. producers, a recent report suggests that aggressive fracking activity may have permanently damaged oil fields.  Although this could mean the loss of potential future output, if the scenario outline above is true, it may be perfectly rational to overproduce in the short run at the risk of lost long-term potential if that oil won’t be consumed in the distant future.  Meanwhile, bankruptcies among oil companies is up 21% from the first three quarters of this year compared to 2019.

One of the issues we have been monitoring is the divergence in the performance of energy stocks compared to the broad index.  The comparison of the energy sector to the S&P shows that, even taking oil prices into account, energy stocks are underperforming.

The chart on the left shows the performance of the S&P energy sector to the overall S&P; we have rebased the indexes to May 1986.  From 2005 to 2014, the oil sector outperformed the overall index.  Lately, the underperformance has worsened.  The chart on the right adds oil prices to the model.  As one would expect, the performance does improve.  But, over the past two years, the underperformance of energy stocks has worsened even with the stabilization of oil prices.  Until recently, if an investor was bullish on oil, they could capture some of the strength in oil prices by purchasing oil equities.  That no longer seems to be the case.  The models suggest there is something much deeper occurring in energy; energy companies are seeing weaker performance independent of oil prices.  This likely means investors are concluding that the future of conventional energy stocks is dismal and this is causing oil stocks to become less sensitive to oil prices.  And, given the forecast future of oil demand, the situation probably won’t get better.

On the unconventional front, we are seeing renewed interest in fuel cells.  Fuel cells have the reputation of being the future of energy and always will be.  We first reported on fuel cells in the mid-1990s.  With rising interest in carbon reduction, fuel cells, merely from improved efficiency, should be part of the mix.  Fuel cells run on hydrogen; the most used current source is from natural gas.  Although fuel cells don’t emit any carbon, natural gas does.  The “holy grail” for the industry is hydrogen from solar or wind.  On the other end of the spectrum, the U.S. is offering $160MM to fund research into small nuclear reactors.  Although nuclear power remains an anathema to the general public, it may be impossible to achieve zero carbon energy without it. 

View PDF


[1] Although we doubt a President Biden would be successful in returning to the Iran nuclear deal, the potential for a return of Iranian oil exports of 2.0 mbpd would be difficult for the cartel to manage.

[2] Hence the decision by Saudi Arabia to take Saudi Aramco public.

Asset Allocation Weekly (October 16, 2020)

by Asset Allocation Committee | PDF

Of all the different economic indicators published by the government and private entities, one of the least followed, but potentially very enlightening, is the Census Bureau’s monthly report on business inventories.  The report tracks the value of inventories on hand each month at the retail, wholesale, and manufacturing levels and compares those values to the amount of sales at each level.  The resulting inventory/sales ratio can help us predict business behavior in the coming months.  For example, if the inventory/sales ratio is higher than normal, it may mean firms are saddled with excess stockpiles and will cut prices or hold back on new orders to their suppliers.  When the inventory/sales ratio is lower than normal, it could portend increased orders and higher prices.  The inventory/sales ratio fluctuates over time because of changes in technology and management practices, but it can still provide important insights over the short term.

As shown by the heavy blue line in the chart below, the overall inventory/sales ratio fluctuated between about 1.35 and 1.40 during the five years leading up to the coronavirus pandemic.  When the pandemic shutdowns hit, many firms saw their sales plummet, leaving their inventories sitting on shelves in their shuttered stores or warehouses.  The overall inventory/sales ratio surged to 1.67 in April.  With the recent reopening of most of the economy, however, the overall ratio has now fallen to 1.33.  Since the current ratio is lower than in the recent past, it may suggest firms would be eager to rebuild their stockpiles if they became more confident that the economic recovery will continue.  Lean inventories may also encourage price hikes or discourage price cuts, helping to alleviate fears of excessively low inflation.

A close look at the detail in the chart is even more encouraging.  Note that before the pandemic, retailers typically carried $1.45 to $1.50 of inventory for every dollar of monthly sales.  In August, however, retailers had just $1.24 of inventory for every dollar of sales, marking their lowest inventory/sales ratio in at least 25 years.  If you’ve finally started to go out shopping again after the lockdowns, you may have noticed that many stores have very little inventory on their shelves.  In part, that may reflect retail managers’ lack of confidence in future demand.  It could also be partly unplanned, reflecting an inability to get new inventories because of supply chain disruptions or reduced financing by skeptical lenders.  In any case, it’s hard to believe retailers would keep their stockpiles this low when the economy returns to normal.  Rather, one would expect an eventual inventory restocking and strongly rebounding orders.

In contrast with the situation for retailers, factory inventories are a bit high compared with recent history.  Rather than carrying inventories worth $1.38 to $1.40 per dollar of sales, as they did before the pandemic, manufacturers recently had about $1.43 of inventory per dollar of sales.  That means that if retail restocking leads to a rebound in manufacturing orders, there could be a modest delay in new production (since the wholesale inventory/sales ratio is right at its recent average, we are ignoring it for purposes of this analysis).  All the same, it probably wouldn’t take long for the small excess in factory stockpiles to get used up.  Manufacturers and raw material suppliers might need to ramp up production quickly, which in turn could require faster hiring.  It’s probably too much to say the economy is a coiled spring ready to snap back to normal.  We still think it will take some time to get over the drag from the pandemic.  All the same, even a gradual normalization process could produce a big acceleration in factory activity, helping boost corporate profits and supporting further stock market gains.

View PDF

Weekly Geopolitical Report – Back to the Future? Prospects for a New Cold War Against China (October 12, 2020)

by Patrick Fearon-Hernandez, CFA | PDF

This edition of our Weekly Geopolitical Report explores the prospects of a new Cold War between the United States and China.  Based on the author’s personal experiences at the end of the U.S.-Soviet Cold War, this report explores the various costs that would likely arise from a new Cold War and what those costs imply for investment strategy.

When I asked her if she had any trouble getting her ticket from St. Petersburg to Moscow to join me for the long weekend, she said, “No.”  Then, with a sly grin and a meaningful glance deep into my eyes, she added, “I just asked for help from a friend in the KGB who works for President Gorbachev.”  I suppose I grinned a bit, too, since she had just confirmed her association with Soviet intelligence, which I had suspected ever since we met in a hotel bar in St. Petersburg weeks before.  If I did let a grin slip out, it probably also reflected the irony of knowing how badly my office at the CIA was going to react to this forbidden dalliance when I got back to Washington.  But it was a beautiful, bright, crisp autumn morning in Moscow in September 1991, just after the attempted coup against Gorbachev, and I was still young.

Read the full report

Asset Allocation Weekly (October 9, 2020)

by Asset Allocation Committee | PDF

Later this month, the European Union will begin auctioning off bonds to facilitate its economic recovery from the pandemic. In all, the EU plans to raise up to €850 billion over the next 5-7 years, with €750 billion still awaiting approval from the European Parliament. If approved, as we expect, the funds will be backed by the full faith and credit of the European Union members and will come in two parts, the Support to mitigate Unemployment Risks in an Emergency (SURE) program and the Next Generation EU (NGEU) program.

The latter will be aimed disproportionately at supporting the most vulnerable and indebted countries within the union such as Greece, Italy, Portugal, and Spain (GIPS). If successful, this program could provide these countries with a needed boost in consumption and income, something these countries have lacked since the start of the financial crisis.

Over the past few years, the GIPS countries were forced to run an export-focused growth model to help repay loans from their respective bailout agreements. This reliance on exports allowed GIPS to boost their internal savings, which made these countries more solvent. However, despite the improvement in internal savings, the removal of labor protections, fiscal protections, and higher taxes in these countries led to deteriorating living conditions and strained public spending. As a result, prior to the pandemic most of these countries were, by design, growing slowly.

In addition, by having an export-focused growth model, GIPS were sensitive to shocks to the global economy. When the pandemic hit, international travel and global trade collapsed. Lockdown and travel restrictions decimated tourism, which provides a significant source of revenue for these countries, and halted production of manufactured goods. Additionally, the drop in world growth has stunted the demand for global exports. Although the world economy has started to recover, it is unclear when global trade and travel will normalize.

With citizens unwilling to undergo additional austerity and GIPS lacking monetary independence, the recovery fund will likely ease some political angst, which has led to increasing populism in Europe. Even before the pandemic, GIPS were struggling to find ways to appease their citizens who have grown tired of constrained growth. In fact, it is possible that if the EU didn’t ease some of its restraints some of these countries would have withdrawn from the EU and the Eurozone. Fears of political unrest that could undermine the integrity of the EU led the richer northern European nations to agree to the bailout package.

This new spending will allow these countries to boost investment in infrastructure projects, healthcare, and digital technology. Additionally, the fund has also set aside money to invest in green technology. Given the lack of consumption over the past few years due to the restrictions of deficit, these countries have been limited in their ability to invest in their respective economies. The €750 billion of funds, of which €390 billion will be used as grants, will likely provide a notable boost in GDP.

The funds are expected to be disbursed in 2021 and in 2022. In the meantime, countries have access to the €100 billion SURE program to help support local businesses and provide unemployment benefits. That being said, assuming the money from the recovery fund is used wisely, we expect the stimulus could make European equities attractive as we believe that years of austerity have led to a lot of pent-up demand in the GIPS countries. As a result, consumer discretionary and real estate could be of some interest.

View PDF