Asset Allocation Weekly (June 2, 2017)

by Asset Allocation Committee

In the last FOMC minutes, policymakers signaled another hike at the upcoming June 14th meeting.  We continue to closely monitor financial conditions but, so far, financial markets are rather sanguine about the impact of policy tightening.

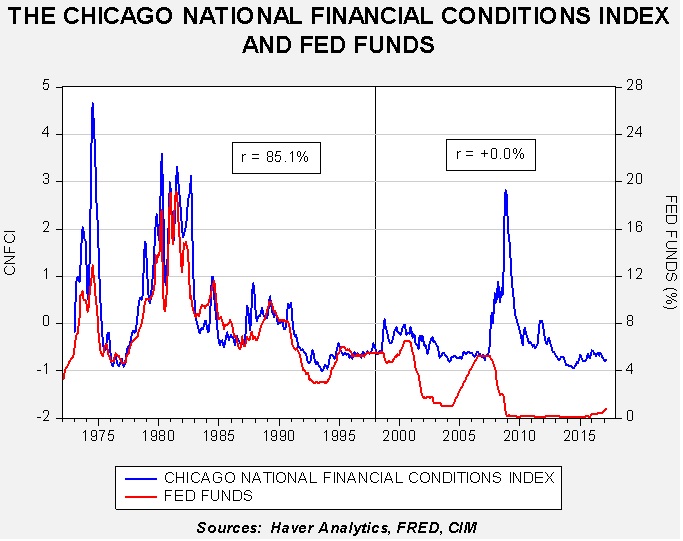
The blue line on the chart shows the Chicago FRB Financial Conditions Index, which measures the level of stress in the financial system.  It is constructed of 105 variables, including the level of interest rates, credit spreads, equity and debt market volatility, delinquencies, borrower and lender surveys, debt and equity issuance, debt levels, equity levels and various commodity prices (including gold).  A rising line indicates increasing financial stress.  The red line is the effective fed funds rate.  Until 1998, the two series were positively and closely correlated.  When the Fed raised rates, financial stress rose; when the Fed lowered rates, stress declined.

We believe there are two factors that changed this relationship.  The first is policy transparency.  Starting in the late 1980s, the Fed became increasingly transparent.  For example, before 1988, the FOMC would meet but issue no statement about what it had decided to do.  Investors and the financial system had to guess whether policy had been changed.  Starting in 1988, the central bank began publishing its target rate.  In the 1990s, it began issuing a statement when rates changed.  Eventually, a statement followed all meetings.  As the FOMC has become more transparent, the correlation between stress and the level of fed funds has changed.  Essentially, the markets now know with a high degree of certainty when rate changes are likely.  This is especially true of tightening.  The FOMC appears to avoid making rate hikes that surprise the market.

The second factor is financial system stability.  From the Great Depression into the 1980s, policymakers put a high premium on system stability at the expense of efficiency.  Bank failures were rare and there were a large number of rather small institutions.  In addition, commercial banks were separated from investment banks.  The drive to improve efficiency led to consolidation among commercial banks and a breakdown of the barriers between commercial and investment banks.  Although this made the system more efficient, it also undermined stability.  Thus, when raising rates, the Fed must pay close attention to system stability to prevent crises, which has tended to lead to gradual and measured policies; this behavior maintains stability…until it doesn’t!

Essentially, policymakers and investors face the Minsky Paradox; the more stable markets become the more risks investors take, leading to conditions that cannot be sustained.  Unfortunately, it’s hard to know in advance when rate hikes become problematic.  It is likely that as rates rise, factors that may have been manageable at lower rates become dangerous at higher rates.  Those conditions can change faster than policymakers can likely react.  For now, there isn’t much evidence of trouble but the fact that policy is tightening raises the likelihood, however small, that problems could develop.

View the PDF

Asset Allocation Weekly (May 26, 2017)

by Asset Allocation Committee

The dollar is in its third major bull market since currencies began floating in 1971.

This chart shows the JPM dollar index which adjusts for relative inflation and trade.  The previous two bull markets exhibited greater strength than the current one.  Because of the dollar’s reserve currency role, there will always be an underlying demand for dollars for foreign reserve purposes.  Thus, U.S. policymakers can run fiscal deficits and tax policies that penalize saving (for example, we tax income instead of consumption) and not suffer from foreign exchange crises.  At the same time, dollar strength can act as a drag on the economy; it tends to make imports more attractive and can undermine the competitiveness of domestic firms.

The previous two dollar rallies were tied to specific fundamental factors.  The 1978-85 bull market was mostly attributable to the Volcker Federal Reserve.  Paul Volcker instituted monetary policy based on money supply growth instead of interest rate targets.  This allowed interest rates to rise to extraordinary levels (fed funds peaked at 19.1% in June 1981) and made the dollar very attractive.  The 1995-2002 bull market was mostly caused by productivity gains, although fiscal surpluses likely contributed as well.  Technology investment began to boost the economy in the latter half of the 1990s and made the U.S. an attractive investment venue.  The surplus reduced available Treasuries and made it difficult to build reserves without bidding the dollar higher.  The current bull market is similar to the Volcker bull market in that it appears to be mostly due to monetary policy.  The Federal Reserve began to reverse its unconventional monetary policy measures before the other major G-7 economies, boosting the greenback.

Valuing currencies is difficult as it is generally true that the currency markets focus on different factors over time.  There are periods when relative inflation is dominant.  During other periods, the external accounts drive the exchange rates, while other times interest rate differentials are key.  The valuation model with the longest history is purchasing power parity, which is based on relative inflation rates.  The thesis is that the exchange rate should act to balance prices between nations and so a country with higher inflation relative to another should have a weaker exchange rate to unify prices across countries.  In practice, we find that not all goods are tradeable, inflation indices are not the same across countries and relative pricing parity models don’t account for capital flows.  Although parity models often deviate from fair value, they can be useful when parity reaches an extreme.

This chart shows the German/U.S. parity model, which uses CPI from Germany and the U.S. to establish parity.  Currently, the exchange rate is nearly two standard errors below parity, meaning the D-mark (or the euro) is undervalued relative to the dollar.  As the chart shows, the exchange rate rarely stays around purchasing power parity.  However, when it reaches the two-standard error level in either direction, it usually means the exchange rate will eventually reverse.  It isn’t uncommon for the exchange rate to remain over or undervalued for a long period of time.  However, we eventually do see a reversal from extreme levels.  Usually, there is a catalyst that brings an adjustment to valuation.  In 1985, it was the Plaza Accord which was specifically designed to weaken the dollar.  The end of the second bull market was likely due to the end of the tech bubble in equities and the Bush tax cuts, which reduced the fiscal surplus.

It appears we are seeing two catalysts that may be signaling the end of this dollar bull market.

The reversal of monetary policy: The dollar initially rallied on the divergence of monetary policy.  The Federal Reserve was ending QE and beginning to raise rates, while the Bank of Japan (BOJ) was expanding QE and the European Central Bank (ECB) was implementing QE and experimenting with negative interest rates.  This kicked off the current dollar bull market that began in mid-2014.  Although the FOMC is planning to raise rates further that action has been well telegraphed.  At the same time, it appears the ECB is poised to raise rates and end its QE program.  And, European economic growth has been strengthening, which will likely accelerate policy tightening.  Even the BOJ is considering easing some of its support.  Given the degree of dollar overvaluation, foreign policy tightening will likely weaken the dollar in the coming months.

Political turmoil is favoring foreign currencies: There is no lack of political turmoil in the developed countries.  We have had two major elections in Europe thus far, with upcoming German elections in the fall and Italian elections expected in February.  Brexit continues to roil Europe.  Tensions are rising in the Far East as North Korea continues to test missiles and threaten its neighbors.  When President Trump won the election in November, the dollar rose on expectations of trade restrictions, tax reform that would support repatriation and infrastructure spending which would boost growth.  As the Trump administration has gotten sidetracked on other issues, these expectations have dwindled.  Even though political risk remains high throughout the developed markets, the high dollar valuation and disappointment surrounding the president’s policies appear to be undermining the dollar.

If the dollar’s bull market is coming to a close, what can we expect?  First, it gives a tailwind to foreign investment.  Emerging markets, which have been strong this year, would likely receive further support if the dollar begins to weaken.  Second, commodities would benefit.  For example, our oil inventory/EUR model for oil prices indicates that a €1.30 would generate a fair value for oil near $78 per barrel, even with the current elevated level of inventories.  Gold prices are traditionally supported by dollar weakness as well.  The asset allocation committee will be weighing the likelihood of dollar weakness and take appropriate measures in the coming months.

View the PDF