Insights from the Value Equities Investment Committee | PDF
“I skate to where the puck is going to be, not where it has been.” – Wayne Gretzky
With the Stanley Cup finals beginning last week in Edmonton — home to The Great One’s four championships — we’re reminded that Gretzky’s approach to hockey can offer valuable lessons for investors as well. Anticipating what is likely to occur and positioning oneself accordingly, rather than focusing on what has transpired, is as relevant on the ice as it is in today’s evolving investment landscape, one that has tended to favor passive investing and growth strategies.
Where Have We Been?
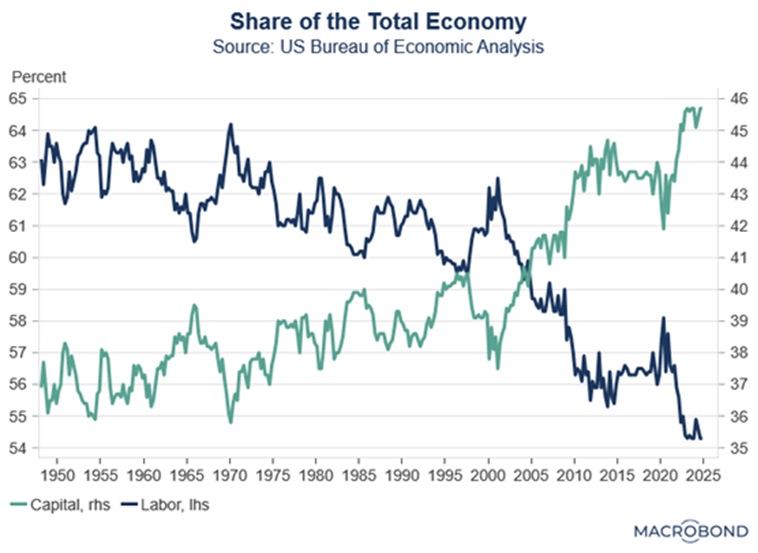
For decades, investors benefited from a backdrop of easing inflationary pressures and declining interest rates, a trend that began in the early 1980s and was fueled by technological advancements, deregulation, and expanding global trade. However, China’s entry into the World Trade Organization in 2001 accelerated the shift of manufacturing overseas, benefiting capital holders while suppressing wage growth for labor. Although consumers enjoyed lower prices, this dynamic contributed to rising income inequality and growing social frustration — a trend reflected in the rise of populist movements both in the US and abroad, exemplified by the campaigns of Bernie Sanders, Donald Trump, and Brexit. Today, we see renewed efforts to restructure trade and bring manufacturing back home, addressing the concerns of Main Street.
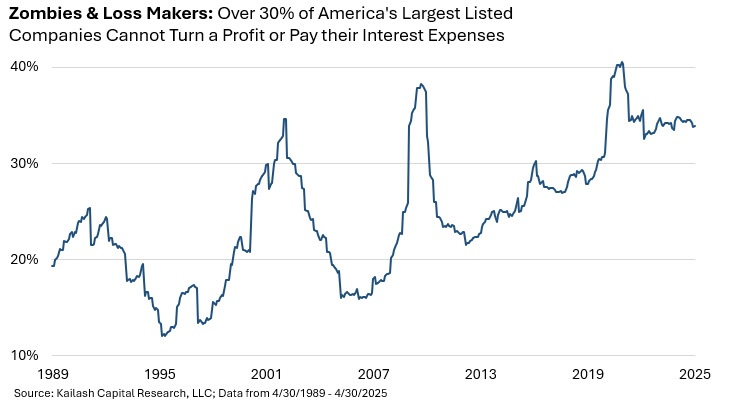
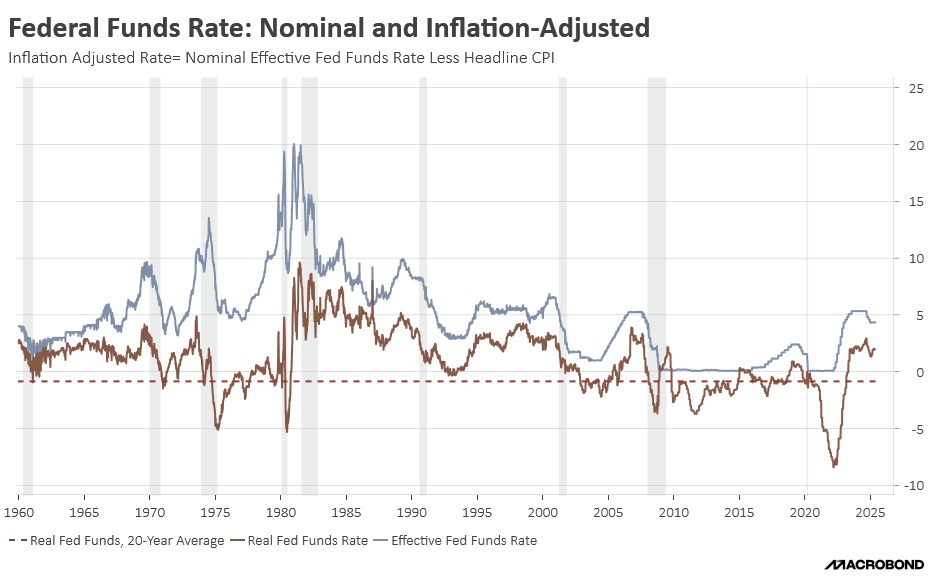
The era following the Global Financial Crisis (GFC) of 2008-09 was marked by unprecedented monetary stimulus. Central banks implemented Zero Interest Rate Policy (ZIRP) and Quantitative Easing (QE), flooding the system with liquidity. These measures kept real interest rates negative, which encouraged spending and investment by making cash holdings unattractive. While these policies shortened the recession, their prolonged use led to riskier capital allocation, with investors prioritizing growth over profitability. As a result, over 30% of public companies are now unprofitable compared to less than 20% before the GFC. Low inflation during this period also enabled governments to run large fiscal deficits, even during peacetime and economic expansion, pushing national debt to record levels relative to GDP.
Passive investing — allocating capital without regard to valuation and in proportion to company size — tends to be rewarded during the later stages of rising markets and periods of low volatility. The late stages can be especially rewarding as new flows are directed proportionally to larger businesses, which have more influence, creating a self-reinforcing cycle. The recent extended economic cycles, with two of the last three being the longest on record, were supported by subdued inflation and accommodative monetary policy. This environment, often described as the “Fed Put,” provided a safety net for investors and helped suppress market volatility.
Where Are We Going?
Today, the landscape is changing. Populism has gained traction, driving policies that aim to benefit Main Street. Tariffs on Chinese goods, initiated under President Trump during his first term and maintained by President Biden, seek to rebalance trade and revive domestic manufacturing. The current Trump administration is also continuing the prior administration’s challenge of monopolistic practices, particularly among large technology firms that have disproportionately benefited capital. These shifts are likely to keep upward pressure on inflation.
Rising inflation has already pushed interest rates higher, ending the era of negative real rates that distorted capital allocation. In this new environment, businesses must focus on generating higher returns on capital to offset increased borrowing costs, bringing fundamentals and valuations back into focus. Moreover, high inflation and elevated national debt will make it difficult to return to the ultra-loose monetary policies of the past.
As a result, investors should prepare for shorter economic cycles, higher interest rates, and increased market volatility. Historically, such conditions have favored active investing and value-oriented strategies over passive investing and growth-focused approaches.
As active managers, we at Confluence take a fundamental approach, one that focuses on understanding and valuing individual businesses with an emphasis on owning competitively advantaged companies trading at attractive valuations. Our active investment approach has been successfully implemented across numerous market cycles over the past three decades.
In light of the current market environment, we believe it’s time to skate to where the puck is going — not where it’s been.

