by the Asset Allocation Committee | PDF
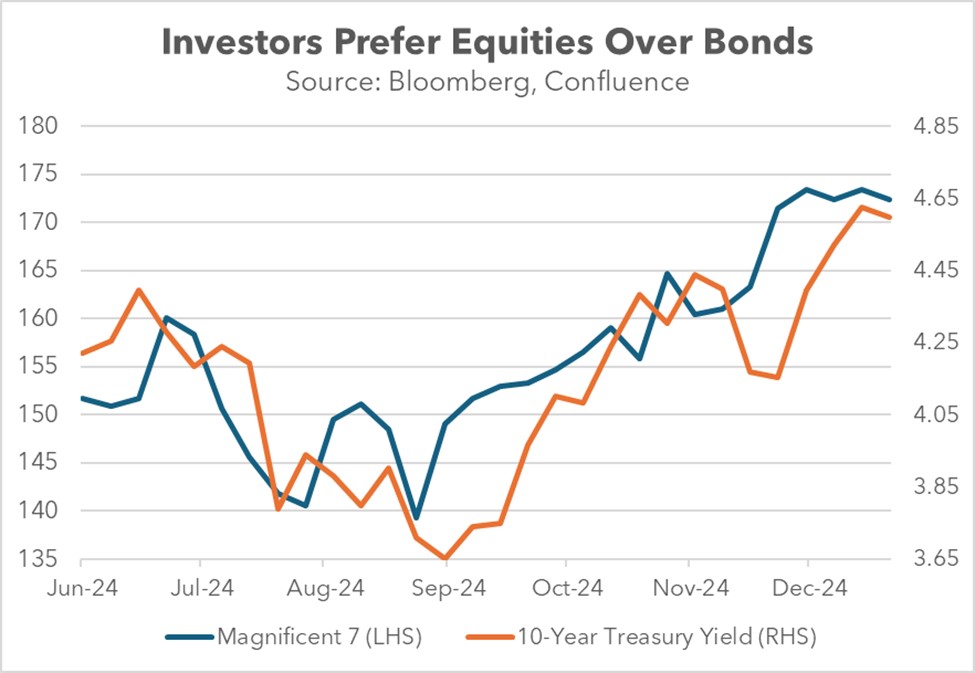
In his testimony before the House Financial Services Committee on February 12, Federal Reserve Chair Powell was questioned about why mortgage rates had not declined. In response, Powell emphasized that the Fed primarily influences short-term interest rates, not the longer-term rates such as those tied to mortgages. Despite the central bank cutting its benchmark short-term interest rate — the fed funds rate — by 100 basis points since September 2024, the average 30-year fixed mortgage rate has risen by about the same amount, highlighting a disconnect between the two.
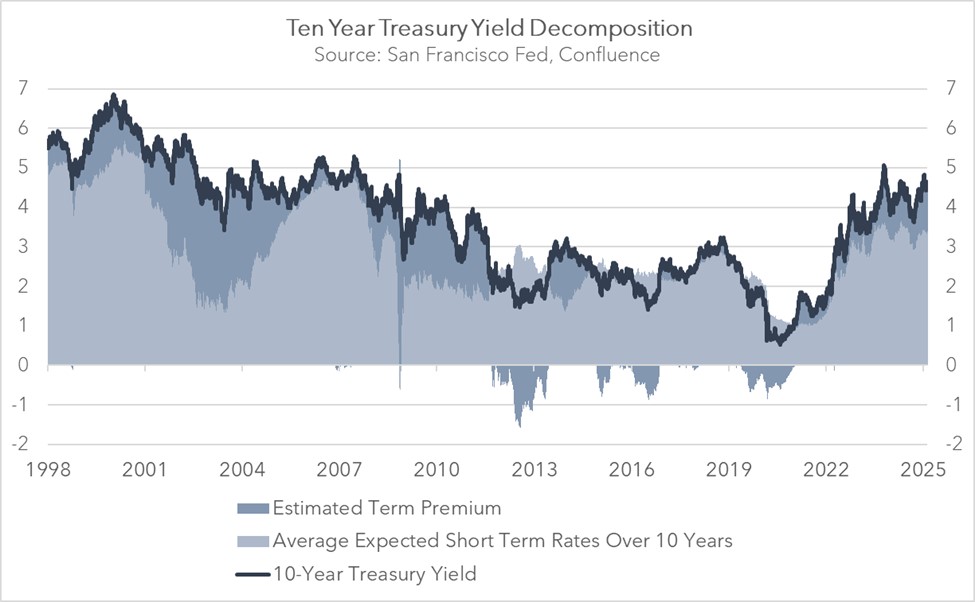
This apparent discrepancy stems from the fact that most interest rates are closely linked to movements in long-term US government bond yields. While average short-term rates, which are largely influenced by the Fed, have remained relatively stable in recent months, the yield on the 10-year Treasury note has picked up.
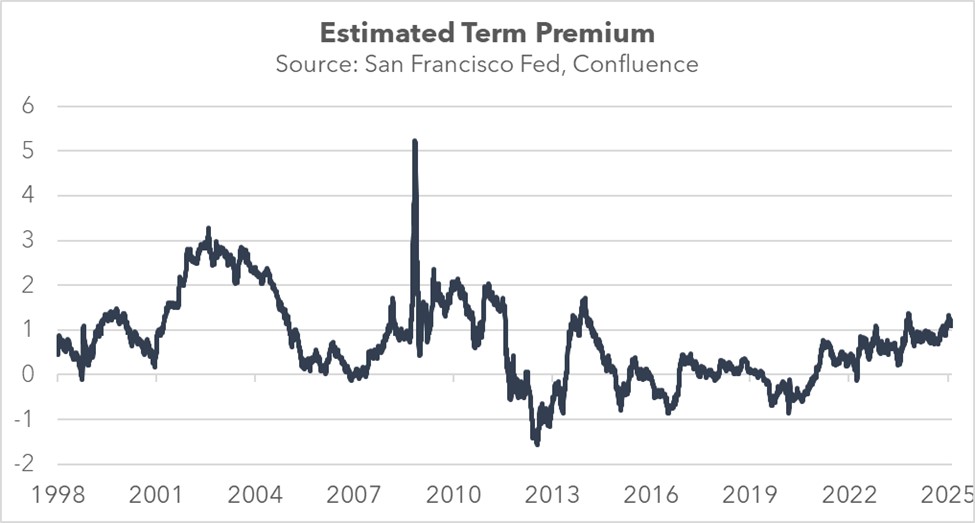
This widening gap between short-term rates and long-term rates, often referred to as the term premium, is an important element for understanding today’s interest rate dynamics (the chart below shows the San Francisco FRB’s estimate of the term premium, which uses expected short-term rates versus the 10-year Treasury yield). The growing gap signals that investors are not relying solely on the Fed’s guidance when valuing assets. This may explain why Treasury Secretary Bessent has emphasized that the administration will focus on reducing 10-year Treasury yields rather than pressuring the Fed to lower its policy rate.
Closing the gap between long-term and short-term interest rates over the next decade will likely be crucial for the administration to reduce borrowing costs effectively for households. This gap represents the premium that investors require to offset risks such as rising bond supply, inflationary pressures, and potential default concerns. To address these challenges, policymakers have proposed a mix of conventional and unconventional strategies.
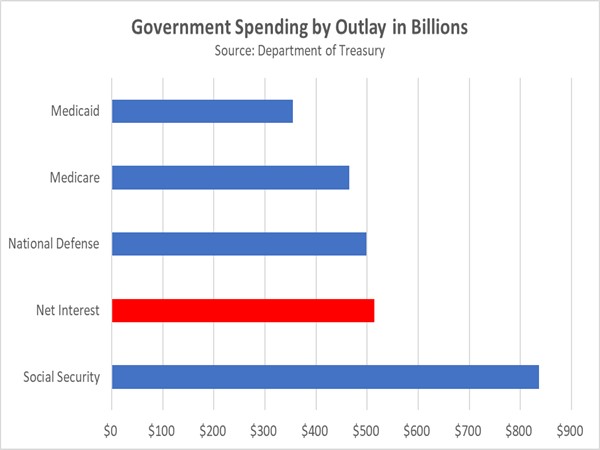
One conventional approach the administration has taken to help reduce longer-term rates is addressing the US debt problem. The incoming administration has focused on trimming government staffing, reviewing payment systems, and proposing budget cuts to social programs as well as potential cuts to defense spending. On the revenue side, proposed measures include closing tax loopholes, such as the carried interest deduction and special tax breaks for sports teams, while also introducing tariffs to generate additional income.
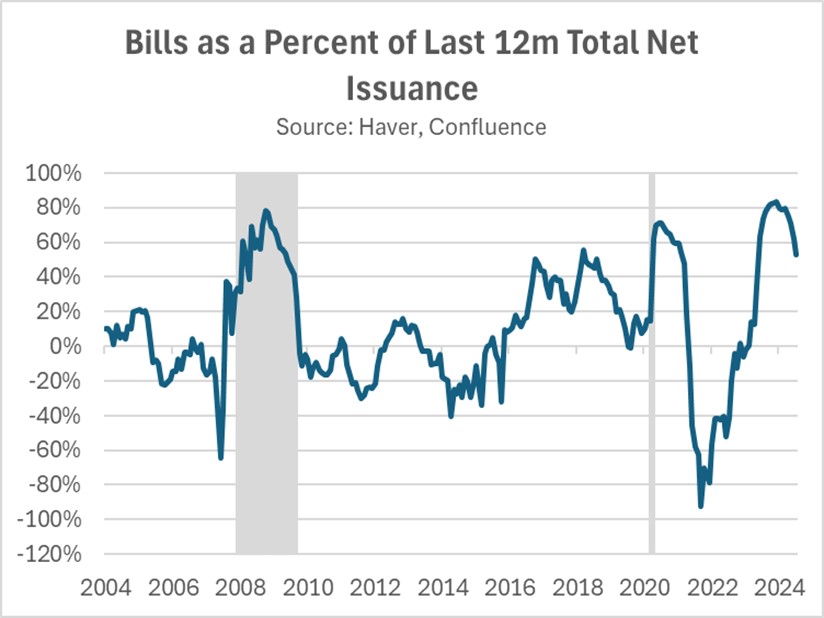
Additionally, the Treasury has explored alternative methods to manage the 10-year Treasury yield through strategic debt management. One approach involves reallocating Treasury issuance toward shorter-dated bonds, mirroring strategies used by the previous administration. Another proposal includes issuing 100-year “legacy bonds,” potentially targeting foreign governments under the threat of tariffs, as a way to diversify funding sources and stabilize long-term yields.
The administration is also exploring regulatory changes to boost the attractiveness of US bonds. One key proposal would exclude US Treasurys and reserves from the calculation of the supplemental leverage ratio (SLR), which affects bank capital requirements. Excluding Treasurys from the SLR calculation could potentially drive significant bank demand for the obligations. This proposal builds on previous precedent, such as the ’temporary suspension of SLR limits during the pandemic, which aimed to improve market-making capacity and support Treasury values.
The Fed could also support the administration’s efforts in two key ways. First, it could signal a willingness to lower the federal funds rate, which would likely boost demand for Treasury bonds. Second, the Fed could pause its balance sheet reduction or begin bond purchases, which could help ease the current supply imbalance in the bond market. While such actions might appear controversial given the Fed’s traditional independence, it is important to note that the two institutions have a long history of maintaining strong communication and coordination when necessary.
In sum, long-term government bond prices could see a modest rise over the coming months, driven by the policies of the new administration. Longer-term Treasury yields could therefore fall, as we projected in our 2025 Outlook. This would likely lead to lower borrowing costs for everyday households, including reductions in mortgage rates, auto loans, and credit card interest rates. However, while the measures discussed above may help compress the term premium, a meaningful decline in long-term yields will likely require a further reduction in short-term interest rates.