

Tag: gold
Asset Allocation Bi-Weekly – Our Take on the Initial Trump Tariffs (February 18, 2025)
by the Asset Allocation Committee | PDF
While investors broadly understood that the new Trump administration would impose import tariffs as a key part of its economic policy, concrete details weren’t available until the initial tariff announcements on February 1. Even though some of those tariffs were quickly “paused,” the announcements gave us our first chance to explore how the administration intends to wield this weapon against other countries. This report provides our first take on the initial Trump tariff policies. As we show below, we think it’s still too early to gauge the impact that trade policy will have on inflation. What we can say is that the policies are likely to be disruptive for many sectors of the global economy, potentially prompting safe-haven buying in US Treasury obligations and precious metals.
In its February 1 announcement, the administration imposed 25% tariffs on most goods from Canada and Mexico, 10% tariffs on Canadian energy imports, and additional 10% tariffs on imports from China. For legal basis, the White House cited emergency economic authority based on fentanyl trafficking from those countries. Within about 48 hours, however, the administration announced a one-month pause in the tariffs against Canada and Mexico after those countries agreed to minor concessions, such as deploying more troops to their borders with the US to clamp down on illegal crossings and drug shipments. As of this writing, Beijing has made no concessions, so the tariffs on Chinese imports remain in place. At some point, the administration is also expected to impose tariffs against the European Union and potentially against multiple individual countries in Asia and beyond.
Mainstream economists tend to believe that import tariffs are inflationary, at least in the short term, because they can restrict the supply of goods to the domestic market. However, we don’t think investors should blindly assume that’s the case. For many reasons, tariffs may not put much upward pressure on prices. After all, some importers may have little market power and be unable to pass the cost of the tariffs onto their customers. In those cases, the importer would simply suffer lower profit margins. The threat of higher input prices might also discourage firms from investing, reducing overall demand in the economy and potentially offsetting price pressures. The impact on prices would likely differ across industries, depending on how quickly each industry can adjust to the tariffs. Therefore, much depends on whether the tariffs are applied broadly against all imports or targeted against specific trade partners and/or products. Finally, retaliation by the targeted trade partner has to be considered. For instance, countries hit with US tariffs might slap tariffs against US goods, thereby slowing down export growth, increasing domestic supply, and weighing on price pressures. The targeted countries might also impose retaliatory tariffs or embargos on their exports to the US, pushing up inflation.
Nevertheless, although it’s difficult to gauge the impact of tariffs or related trade barriers, the discussion above shows they can certainly be disruptive. Even the modest additional tariffs of 10% against the Chinese, which are already in place, will likely prompt reactions from businesses and consumers, and the net impact of those reactions remains unknowable. Beijing has also already retaliated by imposing tariffs on some US goods, preparing to curb shipments of certain minerals to the US, and ratcheting up regulatory scrutiny of US firms operating in China. For now, we think the main market reaction to the tariffs relates to the potential for economic disruption and uncertainty. In particular, it appears the tariffs have prompted investors to bid up safe-haven assets such as gold, silver, and longer-term bonds.
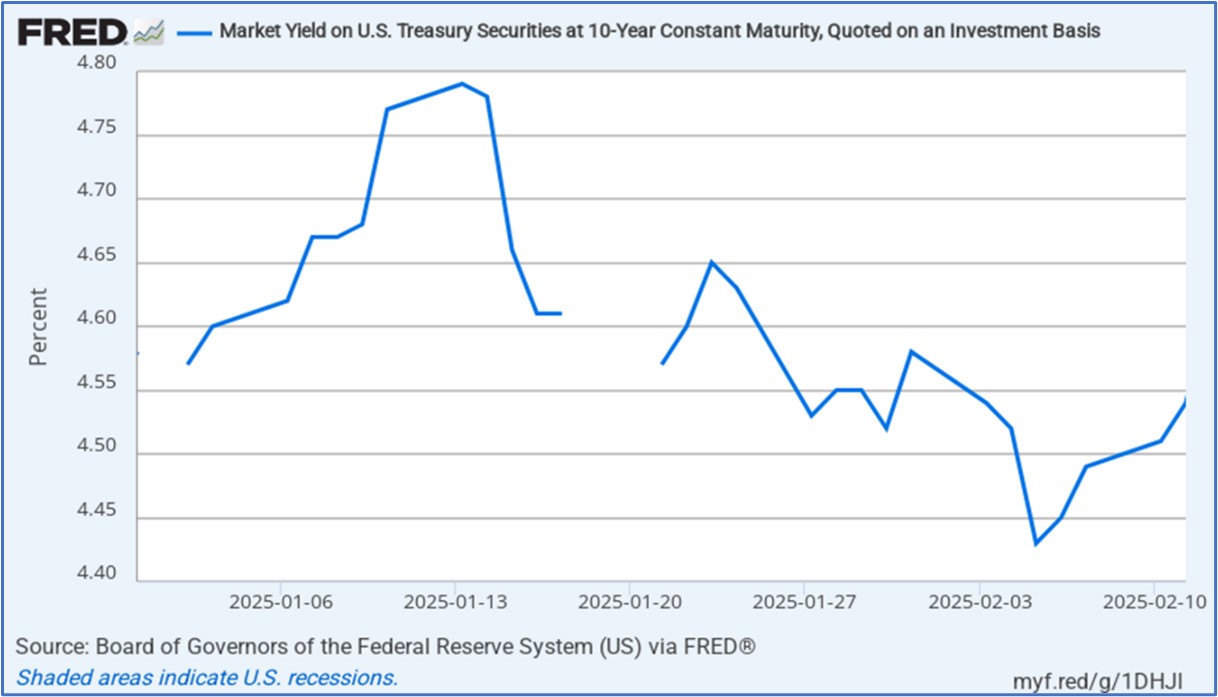
As shown in the chart below, the yield on 10-year US Treasury notes rose sharply to 4.65% over the first two days after President Trump was inaugurated, when investors were pleasantly surprised by the lack of any immediate tariff action despite the president’s earlier promises. Over the following two weeks, however, as the administration put more of its policies into place and investors could sense the possibility of economic disruptions, they bid up Treasurys, driving down yields. Once the Canadian, Mexican, and Chinese tariffs were announced at the start of February, the flight to safety intensified, pushing Treasury yields even lower to below 4.45%, although they have rebounded somewhat since then.
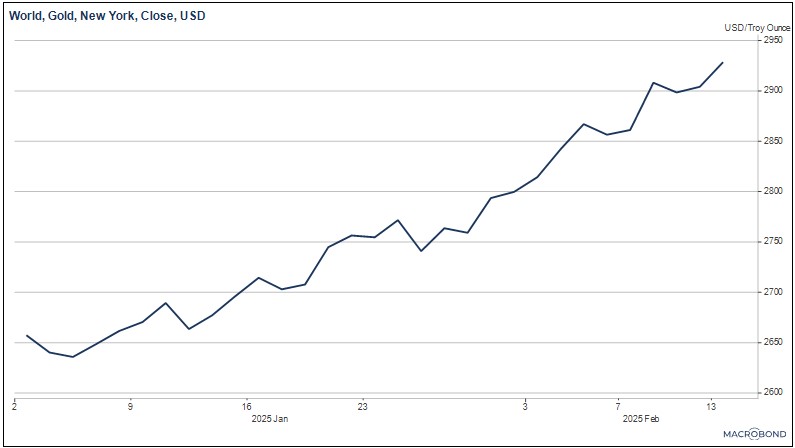
In the next chart, we show the progression of gold prices over the same period. Here, we see a pullback in gold prices in the period immediately after Trump’s inauguration, when his earliest executive orders and other policy announcements still seemed relatively tame to many investors, reducing the demand for safe-have assets. By early February, once the tariffs were announced, the general uptrend in gold prices re-accelerated, driving prices for the yellow metal to record highs above $2,900 per ounce.
As mentioned, it’s still too early to know whether Trump’s apparently neo-mercantilist economic policy and its associated tariff program will be inflationary. However, it does seem clear that investors are focused on the risk that the tariffs will drive prices higher and the potential for them to create economic disruptions. Investors are therefore bidding up traditional safe-haven assets, including longer-term Treasury obligations and gold. If and when the administration applies tariffs to the EU or other economies, we suspect longer-term Treasurys and gold could see another round of safe-haven buying. Based on technical analysis, we think the yield on the 10-year Treasury could be pushed down to its next major support level at about 4.17%, while gold could be pushed higher to its next expected resistance levels of $3,000 or $3,100 per ounce. Treasurys and gold could continue to be well bid until investors sense that the international trade environment has stabilized.
Asset Allocation Bi-Weekly – #68 “Gold: An Update of Current Conditions” (Posted 2/7/22)
Asset Allocation Bi-Weekly – Gold: An Update of Current Conditions (February 7, 2022)
by the Asset Allocation Committee | PDF
Gold moved steadily higher from the late summer of 2018 into August 2020. Prices then declined toward $1,700 and have since traced out a trading range between $1,700 and $1,900. In this report, we will update our views on the metal.
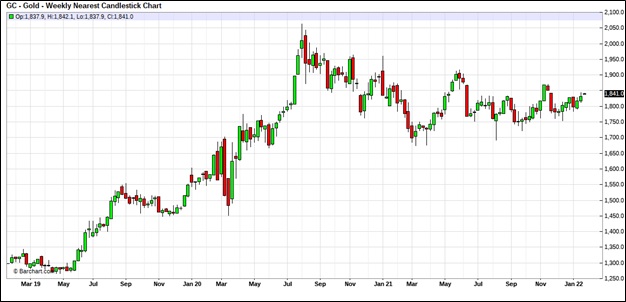 (Source: Barchart.com)
We have been holding gold in our asset allocation portfolios since 2018, although we have diversified our commodity holdings by adding a broader commodity ETF alongside our gold position.
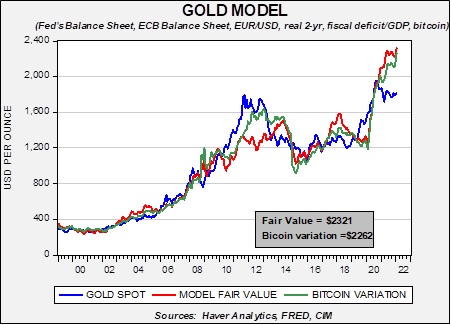
The long-term outlook for gold remains positive. Our basic gold model, which uses the balance sheets of the Federal Reserve and the European Central Bank, the EUR/USD exchange rate, the real two-year T-note yields, along with the U.S. fiscal deficit relative to GDP, suggests prices remain undervalued. To account for the impact of bitcoin, we have added a variation to our gold model to take the cryptocurrency into consideration. In both variations, gold remains undervalued.
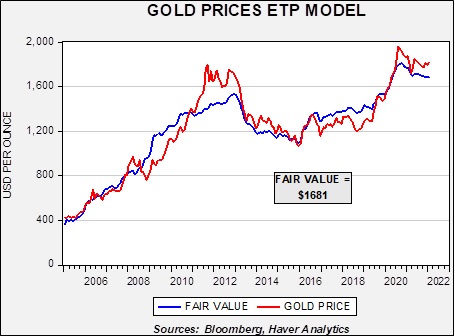
So, what is keeping gold undervalued? We believe it is mostly due to short-term factors. First, investor flows are not high enough to lift gold to our long-term models’ fair value. The chart on the left overlays the price of gold and the fair value based on flows to gold exchange-traded products. Flows suggest gold is actually overvalued. Why are investors shunning gold? Last year, it appeared crypto-currencies were siphoning off investor flows that traditionally would have gone to gold. But with cryptocurrencies falling in price, gold has not benefited, at least not yet. Most likely, fears of FOMC policy tightening are weighing on gold.
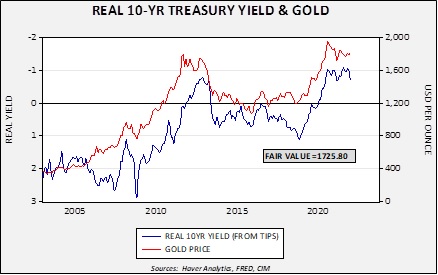
Second, real interest rates, measured by the TIPS spread, suggest gold is overvalued. Real 10-year yields have risen sharply recently, reducing the fair value of gold to $1,725.80.[1] So far, gold has not reacted to the rise in real yields, but it could pressure gold prices in the coming weeks.
In our most recent asset allocation rebalancing, we reduced our exposure to gold, using some of the allocation to increase our position in broader commodities. Concerns about short-term weakness in gold prices played a role in that decision. In addition, we expect some commodities, such as energy, to rally if a geopolitical event occurs in Europe or Asia. At the same time, we remain long-term gold bulls, and thus, we want to maintain an allocation to the metal.
[1] On the chart, the scaling for the real yield is inverted.
Asset Allocation Weekly – #63 “An Update on Gold” (Posted 12/3/21)
Asset Allocation Weekly – #56 “Has Bitcoin Become a Substitute for Gold?” (Posted 10/8/21)
Asset Allocation Weekly – #40 (Posted 5/28/21)
Asset Allocation Weekly (December 18, 2020)
by Asset Allocation Committee | PDF
(N.B. Due to the upcoming holiday season, this report will be the last Asset Allocation Weekly for 2020. The next report will be published on January 8, 2021.)
While 2020 was a year in which the word “unprecedented” has been used a lot, there are many areas where the term is appropriate. One area of interest is in the growth of liquidity. The chart below is one we have featured often, showing retail money market fund levels (RMMK) and the S&P 500.
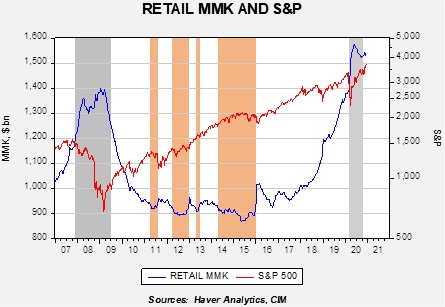
The gray bars show recessions, while the orange bars show periods where RMMK fell below $920 billion. Our position has been that when we are in the orange parts of the chart, there is a dearth of liquidity and equity markets tend to stall. On the other hand, periods of rapid RMMK accumulation have tended to be periods of equity weakness.
In 2018, as the trade war escalated, RMMK began to rise sharply. It continued to rise throughout 2019 into 2020. The pandemic led to another leg higher in RMMK. The level of RMMK has fallen from the highs set earlier in the year but it remains elevated. As noted above, when RMMK rises sharply, equities tend to suffer. We did see some evidence of that in 2018, but last year equities continued to trend higher despite the rise in RMMK. Pandemic worries and a brewing financial crisis led to a sharp selloff in the S&P 500, but the market turned as policymakers moved quickly to support the economy.
It is clear that the level of RMMK is high, but the difficulty is determining “how high.” For that, analysts usually try to scale the data to make it comparable across periods. A logical scale variable may be in comparing the level of RMMK to household financial assets. The problem with that variable is that it is very sensitive to the level of equities; in other works, cash levels seem to rise coincident with a fall in equity values. Most of the decline occurs due to the fall in equity values, not to cash accumulation. The other problem with scaling is finding the answer to the question at hand. What we want to know is if RMMK levels fall, will the funds go to stocks or elsewhere? We assume that RMMK is the closest asset to equities of fixed income; in other words, demand or savings deposits probably represent the desire to hold cash, whereas RMMK is where liquidated financial assets go before they are placed elsewhere.
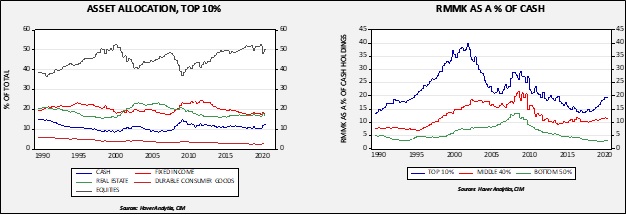
The chart on the left shows the asset allocation of the top 10% of households. Note that about 50% of this income group’s assets are in equities. That is far larger than the middle income group (89% to 51%), which holds 25% in equities, and the bottom 50%, which has equity holdings of 10%. The chart on the right shows that the RMMK holdings for the top 10% group rose from 15% to near 20% from 2018 to 2020, coinciding with the rise in RMMK shown in the first chart.
These charts suggest that most of the RMMK accumulation occurred in an income group most inclined to buy equities. Accordingly, the elevated level of RMMK should be supportive for equities. At the same time, in 2008, RMMK held by the top 10% reached nearly 30%. Thus, we may not see as large of a recovery as we saw during 2009-11. Still, there does appear to be ample liquidity available for stocks, and given the low level of interest rates, flows should continue to be supportive for equities.