by Daniel Ortwerth, CFA | PDF
A time-honored belief holds that inflation is bad for stocks, but recent developments may be challenging this view. In this report, we step through the traditional narrative, review certain recent developments, and consider what might have changed in the relationship between inflation and stocks. Ultimately, we might be entering a world in which investors are increasingly turning to stocks as a hedge against inflation and a store of value in uncertain times.
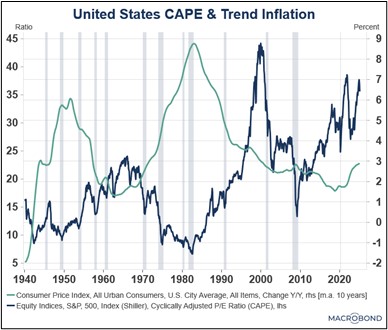
The traditional narrative centers around the idea that inflation suppresses stock price multiples. The chart below shows the inverse relationship that has usually prevailed between inflation and the broad-market price/earnings ratio. Businesses experience inflation in their input costs, which squeezes profits, and lends support to this narrative. As inflation rises, interest rates also rise, drawing money away from stocks and into short-duration fixed income, while simultaneously raising borrowing costs for businesses. Rising inflation also reduces consumer confidence, suppressing investor appetites for relatively risky investments such as stocks.
Figure 1
Recent events have challenged this principle, begging the questions of how it arose in the first place and whether inflation really is bad for stocks in today’s world. The narrative originally gained prominence in the 1970s, a time when inflation in the United States was persistently high and stocks suffered (see Figure 2 below); however, several other factors impacted the economy, inflation, and markets during that period.
- The period began with the United States’ retreat from Vietnam, which caused the wind down of associated expenditures that were primarily in the defense sector but would eventually ripple throughout the broader economy.
- In August 1971, President Nixon closed the gold window, upsetting financial markets. The effects of this move were further exacerbated by loose Federal Reserve policy later in the decade, which undermined faith in the value of the dollar.
- In 1973 and 1974, OPEC placed an embargo on oil exports to the countries supporting Israel — principally the US and UK — heavily impacting prices throughout the US economy and causing a severe recession.
- The five years leading up to the oil crisis had witnessed a strong bull market for US stocks, with valuations for the most-favored stocks of the day (known as the “Nifty Fifty”) reaching more than double the S&P 500 as a whole.
Figure 2
Challenges to the narrative in recent years have taken the form of domestic and foreign stock markets performing well in high-inflation environments.
- Turkey provides the first example (see Figure 3 below). Despite inflation rates between 40% and 75% for most of this decade, its stock market has performed impressively and has solidly exceeded the country’s inflation rate.
- Iran appears to have experienced the same phenomenon as Turkey. Data from Iran has been highly questionable due to concerns of government manipulation, but our recent report on Middle Eastern stock markets provides some details on how its market has posted its impressive performance.
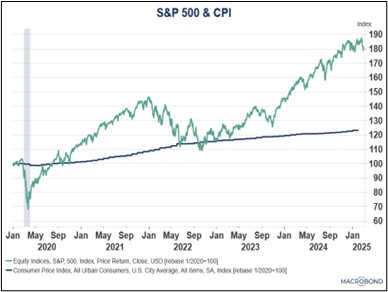
- While nowhere near the extreme levels of Turkey and Iran, this decade has witnessed the highest level of inflation in the US since the early 1980s. Despite this, since the beginning of 2020, the S&P 500 has risen 81%, while the CPI during that same period has risen only 23% (see Figure 4).
Figure 3
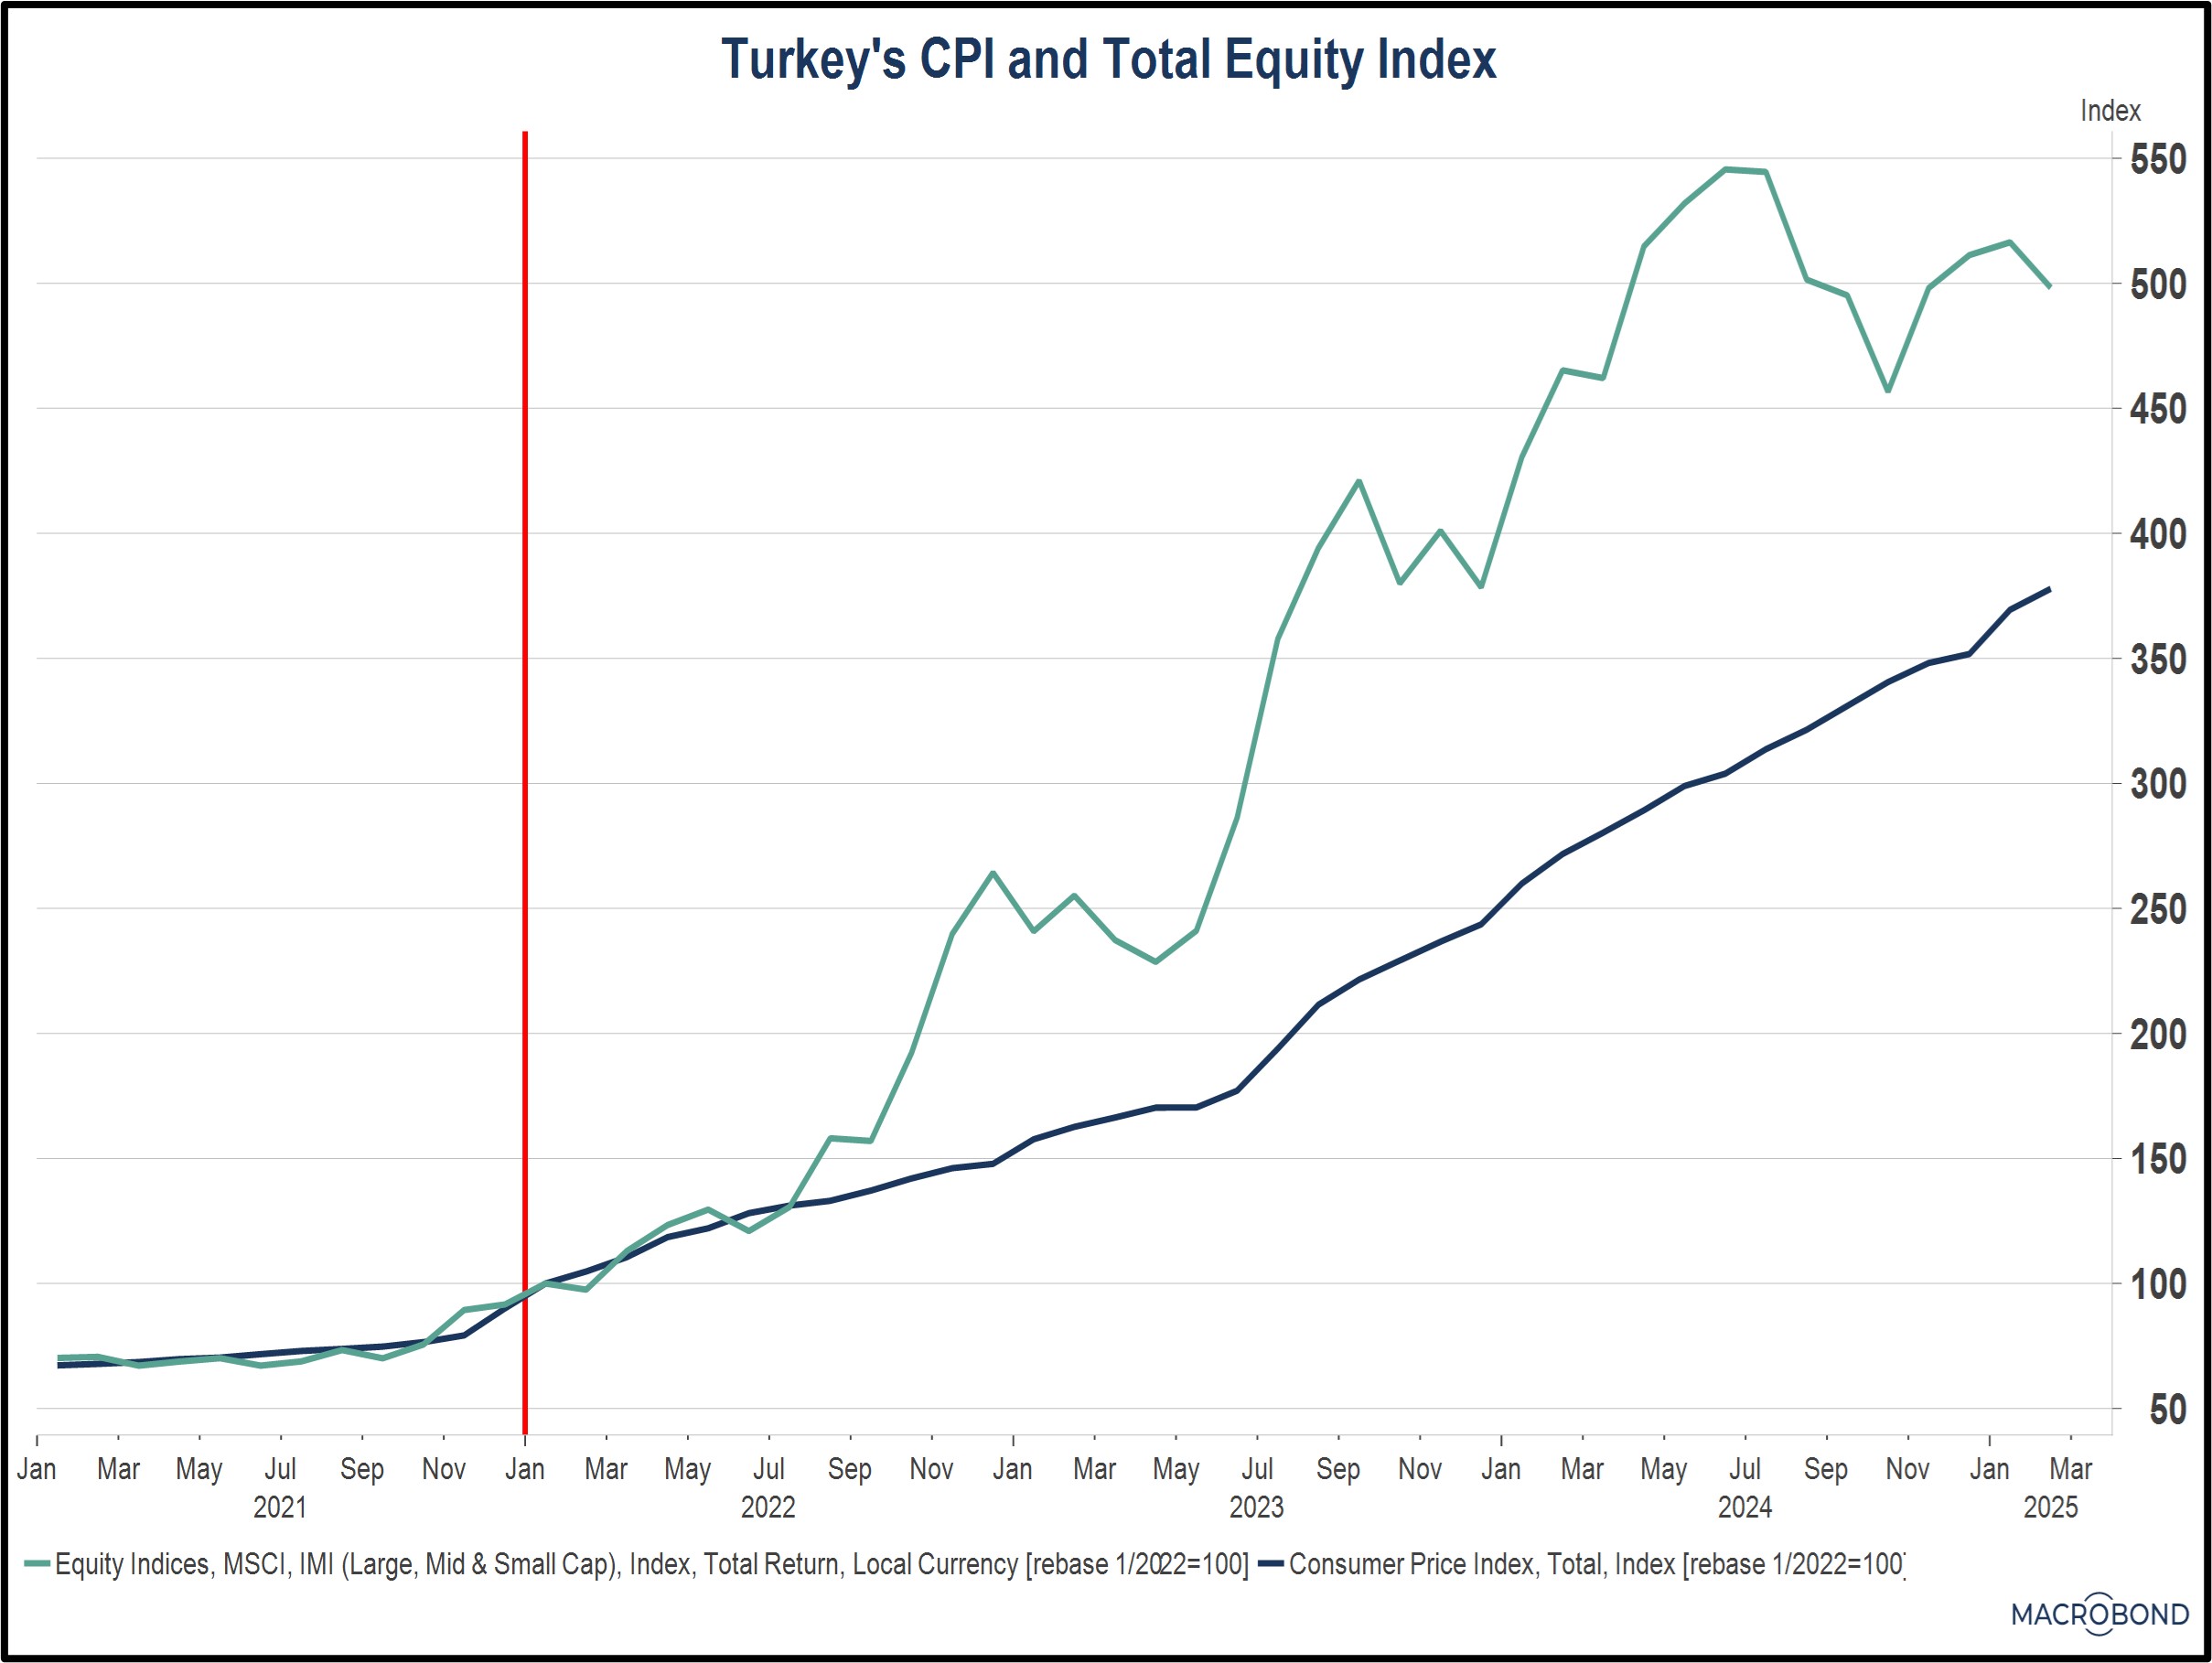
Figure 4
Any number of factors could explain the disparity between the 1970s scenario and these recent examples; however, we are confident that several changes over the last 40 years have likely played a role. Stock market participation has become far more accessible, inexpensive, rapid, and liquid than ever before. A few examples of these changes include:
- Since the 1970s, transaction costs have plummeted. Before 1975, commissions on stock trades were fixed by law at levels that often resulted in fees of hundreds of dollars. By using progressive steps over the decades, commissions today are essentially zero.
- Fifty years ago, settlement time, meaning the number of days from the order to purchase or sell shares until the payment and securities actually change hands, was five days (referred to as “T+5”). Gradually, as trading technology has improved, security regulations began requiring shorter settlement times to the point that, in 2024, the standard became T+1, and there is talk that it may eventually get to T+0.
- Previously, stocks were quoted, bought, and sold in increments of 1/8 of a share. That means the smallest amount a price could change was 12.5 cents. This had a negative effect on trading volumes and liquidity. Starting in the late 1990s, computerizing the process led to decimalization of quotes and trading, which increased liquidity and made the entire process of buying and selling easier.
- Internet technology may have done more than anything to make participation in the stock market easy, accessible, and affordable to virtually the entire adult population. Stock trades used to require relatively exclusive brokerage accounts and telephone communication between broker and client. Now, we trade via cellphone.
- Index ETFs, which did not exist decades ago but are now as broadly available and investable as stocks themselves, give individual investors with modest amounts of money the ability to own broad baskets of stocks and achieve diversification as never before.
Taken together, these regulatory and technological changes have made access to and participation in the stock market almost as easy as using a common bank account.
Does ease of use change or broaden the reasons why people might choose to invest in stocks? Traditionally, we have always associated stocks with long-term investing for the accumulation of wealth. Meanwhile, we have associated other investments, such as Treasury securities, with the preservation of wealth and protection against inflation. Might that be changing? Might the improved liquidity, cost, and accessibility of the stock market, combined with the ability to easily diversify and reduce risk, inspire investors to use stocks as a store of value and an inflation hedge? We have seen evidence of this in certain foreign markets, and we recognize the possibility that this could happen in the US as well. We see this as one more potential reason why stocks might perform better than expected, even in an inflationary environment.