Asset Allocation Bi-Weekly – From Magnificent 7 to European Revival (April 14, 2025)

by Thomas Wash | PDF

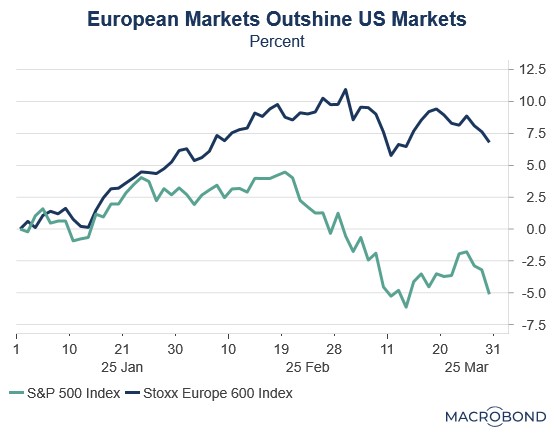
European equities have long suffered from investor skepticism and been burdened by perceptions of excessive regulation, bureaucratic inertia, and elevated operating costs. These structural challenges have historically overshadowed the region’s fundamental strengths. Yet 2025 has marked a striking reversal, with European stocks delivering exceptional returns that have handily surpassed US market performance.

Much of Europe’s recent outperformance relative to the US can be traced to the unwinding of the “Trump trade,” which began in the weeks following Donald Trump’s victory in the November 2024 election. During this time, markets seemed to embrace the narrative that his policies — deep tax cuts, aggressive deregulation, and a pro-growth agenda — would cement US economic dominance. While tariffs were always a part of the equation, investors initially expected them to be used selectively rather than aggressively.

While US equities surged after the November election, European stocks languished as investors anticipated a widening growth divide. The eurozone has now gone seven consecutive quarters without achieving 2% annualized growth in its gross domestic product, a streak dating back to the third quarter of 2022. Nowhere were these struggles more apparent than in Germany, where the industrial sector — traditionally the Continent’s economic powerhouse — became its biggest drag.

Market expectations shifted abruptly in the Trump administration’s early weeks as it simultaneously challenged existing trade arrangements and demanded greater military spending from allies. The tariff threats created immediate uncertainty as businesses shelved investment plans and consumers braced for inflationary pressures. Meanwhile, growing doubts about US security commitments prompted EU leaders to accelerate plans for strategic autonomy.

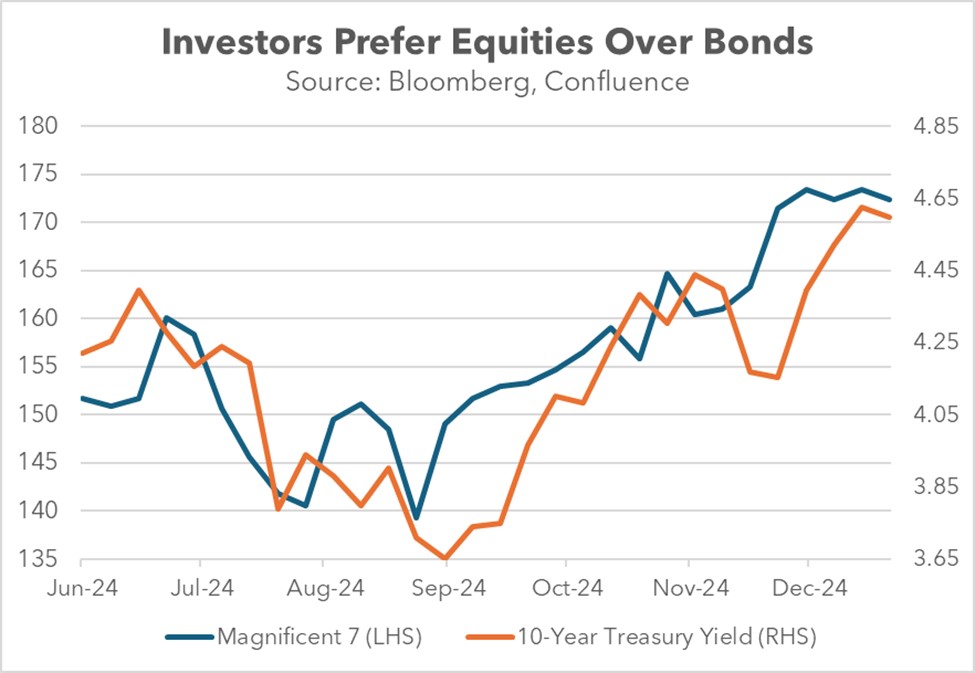
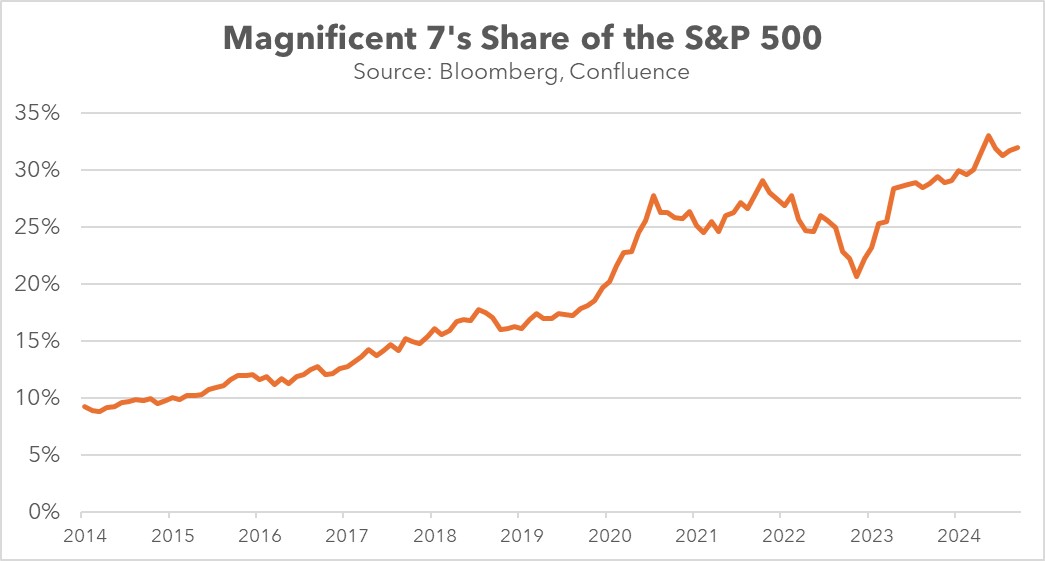
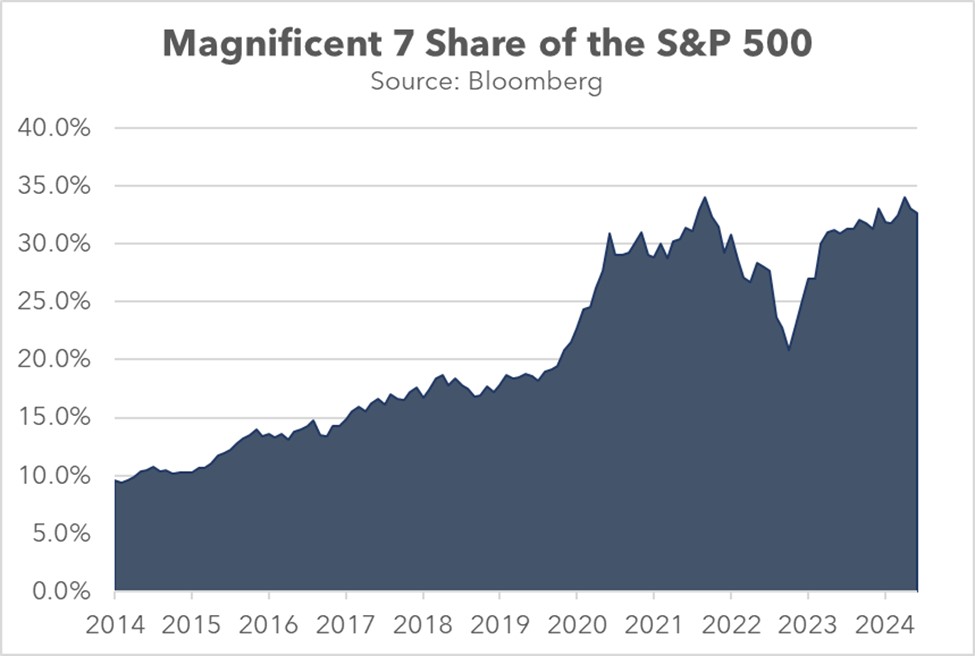
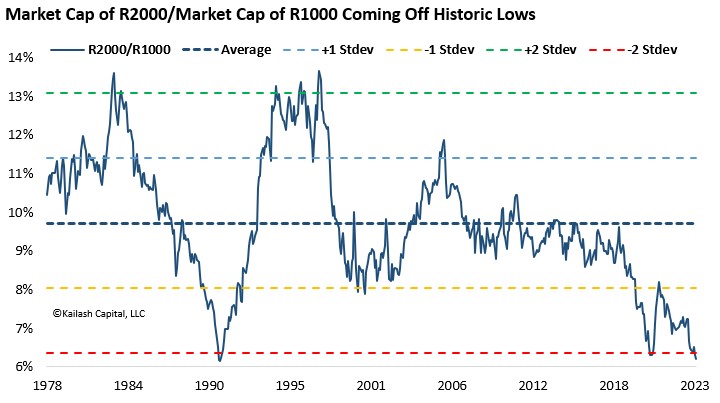
We think the rotation from US to European equities was primarily valuation-driven, with the US’s once-dominant Magnificent 7 declining as investors shifted from growth to value. This marked a dramatic reversal from previous years when tech-heavy growth stocks consistently outperformed. European markets, with their heavier weighting in value sectors and more attractive price-to-earnings ratios, became natural beneficiaries of this change in investor preference.

While capital rotation remains modest to date, escalating trade tensions may accelerate foreign divestment from US assets in favor of European markets. These geopolitical strains have triggered a broad risk-off shift among investors, with capital flowing toward value assets rather than growth equities. This reallocation reflects a fundamental reassessment of global trade dynamics as nations increasingly recognize that traditional US trade relationships may be changing for good.

This shifting sentiment marks a potential inflection point after years of sustained US equity outperformance. For decades, global investors have disproportionately favored US markets, having been lured by three key advantages: (1) superior growth prospects, particularly in the technology sector; (2) unrivaled market depth and liquidity; and (3) the structural strength of the dollar. These factors became particularly pronounced in the post-pandemic era when the greenback’s appreciation created an additional return tailwind for foreign investors.

In an especially important development during this period, the US began running deficits in both its trade balance and its “primary income” balance. This twin deficit was problematic because it signaled that foreign investors were earning higher returns on their US investments than what US residents were earning abroad. In other words, the US was not only importing more than it exported but also paying out more in interest and dividends to the rest of the world than it was receiving.

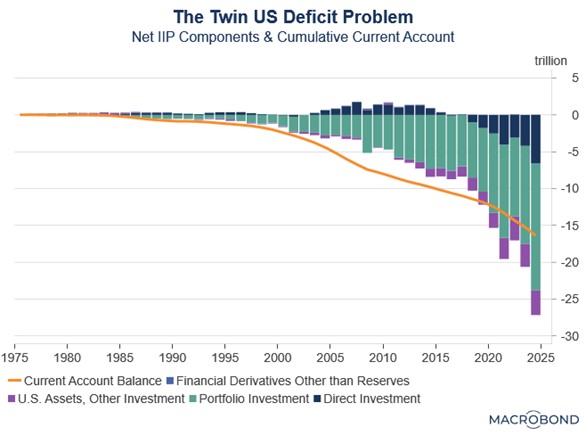
The growing imbalance stemmed from two key factors: persistent US equity outperformance relative to global markets and the Fed’s rate hikes that made Treasurys more attractive to foreign investors. These forces converged in the Net International Investment Position, resulting in the value of foreign-held US assets eclipsing America’s cumulative trade deficit for the first time ever. The shift reflected both a reversal from direct investment surplus to deficit and rising portfolio investment values — twin manifestations of superior US asset returns.

Typically, such conditions would prove problematic for most economies as they could trigger disproportionate currency outflows and subsequent depreciation or make its markets vulnerable to panics. However, the US dollar’s unique status as the global reserve currency and its deep and open capital markets have largely shielded it from these adverse effects.

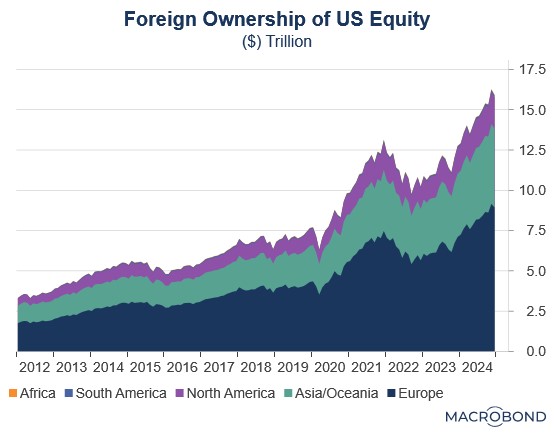
Nevertheless, significant risks remain. US equity markets could experience heightened volatility should foreign investor sentiment deteriorate, with the technology sector being particularly vulnerable due to its elevated valuations. The scale of this exposure is evident in foreign holdings, which now compose over 30% of US equities, driven by a dramatic surge in both portfolio income and direct investment flows.

A sudden erosion of confidence in US equities could precipitate a significant capital rotation into foreign equities and gold. Europe appears particularly well-positioned to benefit from this shift, owing to its relative valuation discount and potential for capital repatriation flows. Within the region, Germany stands out as especially attractive given its increased defense spending commitments. Meanwhile, gold could emerge as the safe-haven asset of choice, with the potential to displace US Treasurys as a reserve asset over time.

View PDF

Asset Allocation Bi-Weekly – Magnificent 7 to the Rescue! (January 21, 2025)

by the Asset Allocation Committee | PDF

The traditional role of Treasurys as a safe-haven asset has eroded. For example, Treasury prices fell in the last quarter of 2024 despite escalating geopolitical tensions in the Middle East, concerns about global economic growth, and heightened political uncertainty in developed nations. This weakening in the demand for Treasurys was largely driven by investor anxieties over the future rate of inflation and the widening budget deficit. For many market participants, concerns about the outlook for Treasurys have fueled a resurgence of interest in the Magnificent 7 as a target for safe-haven flows.

This shift in preference was partly driven by expectations surrounding the incoming administration. Leading up to the election, investors began divesting from US government bonds and purchasing mega-cap tech stocks. This shift reflected growing optimism for a pickup in economic growth and declining confidence in the Federal Reserve’s ability to cut interest rates. Consequently, from September to December, the yield on the 10-year Treasury note surged nearly 100 basis points, while the Magnificent 7 stocks surged almost 24%.

The unraveling began when the Federal Reserve initiated a series of rate cuts last fall. Despite the Fed lowering interest rates by 100 basis points across its final three meetings, the 10-year Treasury yield surged by a comparable amount instead of declining. This divergence stemmed from policymakers’ reluctance to commit to further monetary easing, particularly as the economy showed signs of accelerating. The presence of two dissenting votes during these meetings further reinforced concerns that the central bank may be hesitant to loosen policy.

The Fed’s unwillingness to commit to aggressive rate cuts has led investors to turn to equities. Growing optimism about economic growth propelled the S&P 500 above 6,000 for the first time ever. The change in investor sentiment was further reinforced by growing confidence from the outcome of the November election, which is widely expected to favor policies that will bolster corporate earnings and consumer demand.

Specifically, investors gravitated toward the Magnificent 7, a cohort of tech giants perceived as capable of generating robust earnings and rewarding shareholders even in a high interest rate environment. This group, which makes up more than a third of the S&P 500’s market capitalization, is projected to significantly outperform the broader index in Q4 earnings, with an estimated 20.7% growth compared to the S&P 500’s overall projected growth of 11.9%.

While stock-price appreciation has been a strong motivator, investor preference for the Magnificent 7 has been further solidified by the companies’ intent to increase shareholder returns. Last year witnessed some notable examples, including Meta and Alphabet issuing their first dividends, Apple executing a massive $110 billion stock buyback, and Nvidia announcing a stock split. The potential for these companies to produce robust earnings growth, coupled with the prospect of lower corporate tax rates, would further enhance their ability to return capital to shareholders.

Looking forward over the coming year and beyond, uncertainty about the future trajectory of interest rates and the fiscal outlook will likely continue to weigh on bond values. Some safe-haven buying may therefore shift to gold and other precious metals, while others could shift to large, stable, dividend-paying value stocks. Still, it wouldn’t be a surprise if many investors favor large cap growth companies because of their strong track record of consistent earnings growth and demonstrated commitment to shareholder returns. However, we think that investors trying to use large cap growth stocks as a safe haven should remember that they are currently very richly valued and could be at risk for correction at some point. Investors should remain mindful of their true risk tolerance before using growth stocks like the Magnificent 7 for safe-haven purposes.

View PDF

Asset Allocation Bi-Weekly – The Benjamin Button Dividend (September 16, 2024)

by the Asset Allocation Committee | PDF

A company’s journey to industry prominence typically involves several stages: launch, growth, shakeout, maturity, and decline. Historically, large capitalization stocks were often considered to be in the maturity stage of their development. Many investors therefore assumed that these companies had strong enough earnings to initiate or maintain dividend payments, making them seem more attractive than their smaller counterparts that were primarily considered for their capital gains potential. However, recent trends suggest that times have changed.

Over the past seven years, small cap stocks have consistently surpassed their mid-cap and large cap counterparts in terms of estimated dividend yields. This gap can be attributed to both relative price appreciation and dividend policy. During this period, the large cap S&P 500 stock price index grew nearly twice as fast as the mid-cap S&P 400 price index and the small cap S&P 600 price index. Additionally, small firms have significantly increased their dividend payout ratios relative to their larger peers, from just under 40% to over 60% in the last decade. In contrast, large cap firms have maintained relatively stable dividend policies over the same period.

The primary shift in the relationship between the small cap and large cap indexes has been driven by a changing sectoral composition, largely due to the survivorship and maturation of technology companies. As smaller tech companies have grown and become more successful, they have been rebalanced into the large cap index or were bought out. Meanwhile, those that failed to move up were removed. This dynamic has led to a significant increase in the weight of the tech sector within the large cap index at the expense of the small cap index.

Over the past decade, information technology and communication companies have significantly increased their share of the large cap S&P 500 index, rising from 22.0% to 39.0%. In contrast, the small cap S&P 600’s exposure to tech companies has declined from 20.0% to 16.5%. As a result, the broad large cap index now exhibits more growth-like characteristics than its smaller counterparts. The S&P 500’s price-to-earnings ratio of 25.1 is substantially higher than those of the S&P 400 and S&P 600, which are each around 19.0. Moreover, the large cap index has become increasingly susceptible to price fluctuations in a select group of companies.

While tech companies have lost share within the small cap index, financial services and real estate firms have largely filled the void. Their rise was driven in part by low interest rates, which incentivized investors to seek assets with capital gains potential. This preference led to a surge in demand for large cap tech companies, which were perceived to have strong growth potential, at the expense of financial services and real estate firms, which paid dividends but were seen as less likely to appreciate significantly over time.

The substantial increase in the small cap index’s exposure to the Financials and Real Estate sectors is primarily attributable to reclassifications. Beginning in 2018, larger financial and real estate firms began to decline in market value, leading to their reclassification from the S&P 500 to the S&P 400. This trend intensified following the pandemic as many of these companies experienced further declines and they then made their way into the S&P 600.

These changes have resulted in a relative increase in the number of firms paying out substantial dividends within the small cap index. Over the past six years, the S&P 600’s exposure to financial and real estate companies has increased from 22.1% to 27.6%, while the S&P 500’s share has decreased from 17.6% to 15.7%. The S&P 400 saw a slight decline from 26.1% to 25.0% in its holdings of these sectors. Notably, the small cap index now has as many financial services and real estate firms as the large and mid-cap indexes had combined just 10 years ago.

Contrary to popular belief, a company’s size is not a reliable indicator of maturity. In fact, the average lifespan of S&P 500 companies has dramatically decreased in recent decades. The influx of tech companies into the large cap space has further accelerated this trend. In 1984, the average company survived 36 years, whereas today that figure is barely over 18 years. To put it into perspective, these companies are barely old enough to vote and not yet old enough to drink. This shorter tenure may explain why larger firms often exhibit less mature behavior than some of their smaller, dividend-paying counterparts, which have a weighted average lifespan of at least 32 years. In sum, investors seeking dividend income may now need to focus more on small cap companies than they did in the past.

View PDF

Magnificent…Small Caps? Why Now and Why Confluence (April 2024)

A Report from the Value Equities Investment Committee | PDF

Why Small Caps?

Small capitalization stocks have spent the better part of 10 years in the shadows of their larger cap brethren but now currently provide an attractive opportunity, in our estimation. The divergence has been driven primarily by the narrow focus on a select few mega-cap technology-oriented businesses. This has led the Russell 2000 Index to trade at two standard deviations below its average relative to the Russell 1000 Index (see Figure 1), which was last reached during the Savings and Loan (S&L) Crisis of the late 1980s/early 1990s.

(Source: Kailash Capital)

Additionally, the divergence has placed the relative valuation of the Russell 2000 at levels last witnessed toward the end of the dot-com boom of the late 1990s/early 2000s. This has some investors questioning the vitality of small caps. However, we view the relative underperformance as cyclical, driven by the prolonged accommodative monetary policy that followed the Great Financial Crisis of 2008-2009, which seems to have encouraged a more aggressive allocation of capital toward tech and unprofitable small caps.

Read the full report

Is It Different This Time? (December 2023)

A Report from the Value Equities Investment Committee | PDF

For the better part of the past seven years, the broad indexes have been driven by the strength of a handful of mega-cap technology-oriented businesses, namely: Alphabet, Amazon, Apple, Meta, Microsoft, NVIDIA, and Tesla. The narrow focus is beginning to cause some investors to question if there has been a permanent shift in the investment environment, a shift that is so noticeably different from the past that we need to discard the traditional rules of investing and conclude that “this time is different.” That last phrase is credited to Sir John Templeton, investor and philanthropist, who often stated that those are the four most dangerous words for investors. Heeding Sir John’s advice, one should be wary of assuming that current market conditions and trends will persist indefinitely. The failure to recognize underlying similarities to past events may lead to irrational expectations and imprudent investment decisions. This Value Equity Insights report strives to offer some perspective on the bifurcation that has occurred in the current market and provide some historical context in order to help investors navigate the investment landscape more safely.

Background

The market cap-weighted indexes, such as the S&P 500, have been heavily influenced of late by the mega-cap names, and more specifically, the seven technology-oriented businesses mentioned earlier which have been referred to in the media as the Magnificent Seven (M7) due to their recent stellar returns. While the M7 businesses have benefited from a handful of trends centered around a more connected, intelligent, and mobile society (not to mention the COVID lockdowns), their relative stock performance has created a bifurcated and very concentrated market, one that has parallels to many of the past periods of excessive exuberance.

Read the full report