by the Asset Allocation Committee | PDF
While there has been some speculation that the US economy may be headed for a recession, one indicator suggests it has already begun. The “Sahm Rule,” a widely used metric for determining the early stages of recession, was triggered in July. Created by former Federal Reserve economist Claudia Sahm, this rule posits that the economy is in recession when the three-month average of the unemployment rate rises by at least 0.5 percentage points above its lowest level in the past year. In July, after five straight increases in the unemployment rate, the three-month moving average stood 0.53 percentage points above its low point over the last year. However, while the indicator has a strong track record of signaling when the economy is in recession, this time might be different.
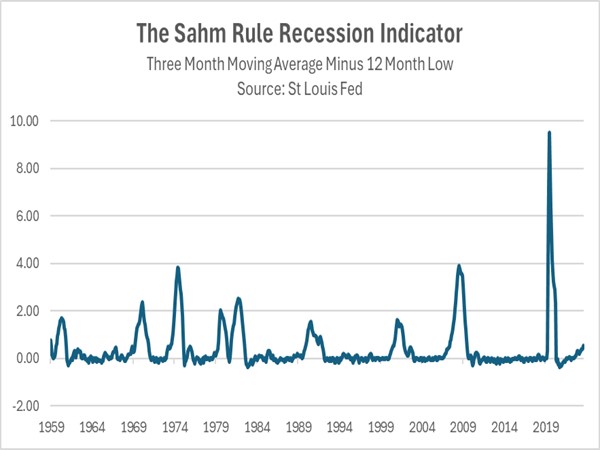
The Sahm Rule is a coincident recession measure, but other data suggests that the economy remains firmly in expansion as opposed to contraction. For example, the unemployment rate currently stands at 4.3%, below the noncyclical rate of 4.4%, and therefore still indicates full employment. Moreover, the latest report on gross domestic product showed that growth accelerated from an annualized rate of 1.4% in the first quarter to 2.8% in the second quarter. That contradicts the technical definition of a recession, which requires two consecutive quarters of economic contraction.
Doubts about the Sahm Rule’s veracity become more apparent when looking at the underlying drivers of the recent increase in joblessness. The reported increase was fueled in part by a dramatic surge in the number of people entering the civilian labor force — workers and those seeking employment. Notably, the number of new and re-entering workers has expanded by nearly 17% from a year ago, a sharp reversal from the pre-pandemic downtrend. Immigrants filling job vacancies were a strong driver of this growth, although women and retirees also contributed significantly to the increased labor force participation.
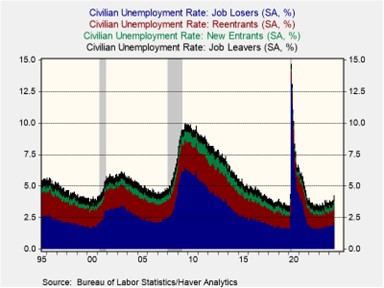
All the same, there are worrying signs within the labor market data. Job creation has decelerated sharply since the year began, with no net new hires in July compared to the previous year. Concurrently, job openings have been declining since 2022, and initial jobless claims are on an uptrend. Furthermore, while the share of job losers remains near historical averages, it has recently shown signs of increasing.
The Sahm Rule’s activation is a notable indicator of a cooling labor market. However, declaring a recession based solely on this metric would be premature, given overall employment levels and other indicators showing many economic sectors are still growing. Nevertheless, recent data may prompt the Fed to ease monetary policy more aggressively to prevent a hard landing. Consequently, an interest rate cut in September of 50 basis points now looks possible, with subsequent easing contingent on incoming data.
Note: There will not be an accompanying podcast for this report.