Tag: money market funds
Asset Allocation Bi-Weekly – Household Cash Levels and the S&P 500 (December 9, 2024)
by the Asset Allocation Committee | PDF
Retail money market levels remain elevated.
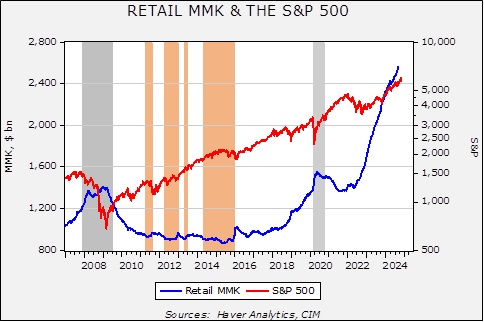
This chart shows the weekly Friday close for the S&P 500 along with the level of retail money market funds. In general, cash being held can either remain held, be used to purchase goods and services, or be used to buy financial or real assets. If the liquidity isn’t available, it doesn’t necessarily mean goods and services or financial assets can’t be purchased. It does mean, however, that some lender must provide funds for the purchase or some other asset must be sold to provide the liquidity. On the other hand, if cash is available, it makes the conversion easier. Since 2022, the level of money market funds has soared. Despite these high levels of money market funds, the S&P 500 has continued to move higher.
Note that after both the 2009 lows and the post-pandemic recession, we saw a rally in equities and a corresponding decline in money market funds, suggesting the rallies were supported by using the liquidity of money market funds to buy stocks. The areas in orange on the chart show how equity market uptrends tend to stall when retail money market levels decline to around $940 billion.
One of the often-heard comments in the financial media is that equities will be supported due to the elevated levels of liquidity available. However, there is an issue with this statement: How does one determine “elevated”? The usual way is to scale the level of liquidity to some other relevant variable. It is not uncommon to scale the level of retail money market funds to stock market capitalization; this would tell you where the level of cash is relative to the overall equity market. By this measure, the level of retail money market liquidity is unremarkable. However, this may not be the best way to scale this variable. Since cash could be spent on goods and services, it might make sense to measure cash levels against spending. If cash levels are low relative to spending, it may suggest that this liquidity won’t be used for financial assets but to support future spending.
Another complicating issue is that there is a clear divergence in asset allocation and income classes. The top quintile is the only one in the US that has its largest allocation in equities. The remainder of the income classes have residential real estate as their primary asset. Thus, focusing on the cash available to the top quintile is likely to have the greatest impact on equity markets.
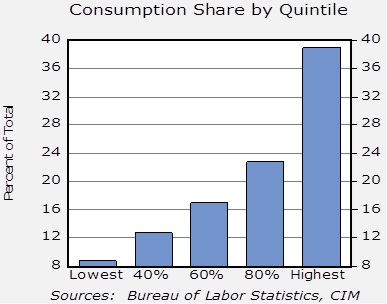
The level of cash by income quintile is made available in the Federal Reserve’s Financial Accounts of the US, often referred to as the flow of funds account. To scale this cash, we then looked at the past four decades’ average consumption by quintile.
Although poorer households have the largest marginal propensity to consume, the top 40% of households represent over 60% of consumption.
In the next step, we compared the level of cash of the top quintile to their average consumption. This gives us a sort of “velocity” measure of their spending. The lower the velocity, the more cash available for financial assets.
For the lowest quintile, the cash level to consumption ratio fell moving into the pandemic, then rose steadily, suggesting a rather high level of consumption relative to cash. This may account for the low level of sentiment about the economy as recently noted in the political media. Compare that to the highest quintile on the right graph. The spending to cash ratio has been steadily declining and, at current levels, suggests more-than-ample liquidity for purchasing financial assets (or, to be fair, more goods and services).
Overall, we conclude that the level of liquidity will likely be a supportive factor for financial assets, including equities. Obviously, there are several factors that will determine how this cash might be deployed. For example, the cash might find its way into private markets, or if cash yields are attractive enough, it may simply “stay put.” However, with the Fed easing monetary policy, the odds are increasing that this liquidity will find its way out of cash. Thus, investors should be prepared that the equity markets, which appear richly valued at present, could become even more overvalued.


