

Tag: oil
Bi-Weekly Geopolitical Report – Middle East: Land of Fault Lines (May 6, 2024)
by Daniel Ortwerth, CFA | PDF
Conflict in the Middle East is one of the most persistent themes in current events. Not only is this true today, but Middle Eastern discord has dominated the news flow throughout most of our lives. At Confluence, we recognize that this enduring pattern of strife reveals the presence of many major fault lines that run through Middle Eastern society, politics, economics, and relations with the rest of the world.
A fault line is defined as a “divisive issue or difference of opinion that is likely to have serious consequences.” A major fault line is one in which the competing forces have both deeply embedded positions and the resources to support those positions. Many issues of this type characterize those in the Middle East, which explains why conflict in the region is so common despite repeated attempts at resolution. Investors must be prepared for this trend to endure for the foreseeable future, which will continue to meaningfully impact global affairs.
This report briefly reviews the main fault lines that define the Middle East from a geopolitical standpoint. This is not a complete list, but rather it is a selection of those we consider most enduring and impactful. Confluence does not take positions on these issues, but we will summarize and show how they produce complexity. We arrange these prominent fault lines in three layers: the ancient fault lines, the more modern ones, and the present-day issues that are currently causing “geopolitical earthquakes.” While these earthquakes do raise the risk of escalation into a broader regional war, we remind readers that the region has often witnessed this increased level of risk before without necessarily leading to further escalation. Rather than trying to predict the outcome, we recommend that investors pay attention to key implications, which we will highlight at the end of the report.
Don’t miss our accompanying podcasts, available on our website and most podcast platforms: Apple | Spotify
Bi-Weekly Geopolitical Podcast – #44 “Venezuela Threatens Guyana” (Posted 3/25/24)
Asset Allocation Bi-Weekly – #113 “U.S Oil Production at a Record High” (Posted 2/5/24)
Bi-Weekly Geopolitical Podcast – #35 “The Oil Weapon Returns” (Posted 10/2/23)
Bi-Weekly Geopolitical Podcast – #31 “The Issue of the Terms of Trade” (Posted 6/16/23)
Bi-Weekly Geopolitical Podcast – #24 “Enter the Petroyuan” (Posted 3/6/23)
Quarterly Energy Comment (December 17, 2019)
by Bill O’Grady
The Oil Market
Since June, oil prices have held mostly within a range of $50 to $60 per barrel.
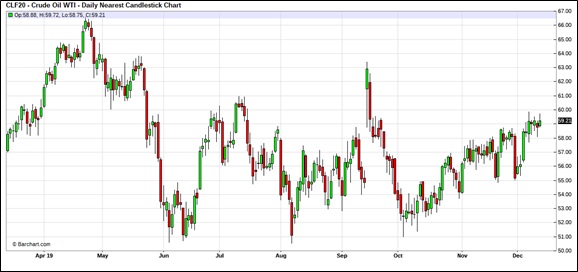
After a sharp decline in prices from late May into early June, due in part to a contra-seasonal build in inventories, inventories fell and oil prices rebounded. Rising tensions with Iran added to the lift in prices in September. Since then, we have seen a retest of the lower end of the range and a steady recovery. Soon after year-end, we usually see a seasonal rise in inventories, which tends to weigh on prices. However, with the advent of exports, that seasonal pattern has become suspect. For example, last year we didn’t see the usual increase in stockpiles.
Thoughts on Oil Demand
In general, forecasting demand is not usually a priority in commodity analysis. The shape of most short-run commodity demand curves is inelastic, which means that quantity isn’t very sensitive to price. Demand inelasticity means that a small change in supply can have outsized effects on price. It is because of that structure that commodity analysts tend to focus on supply. That being said, demand is important over the long term. For example, the effect of environmental regulations and consumer sentiment has adversely affected coal demand and severely depressed prices. The price of coal didn’t fall because supply expanded; it fell because demand declined.
Quarterly Energy Comment (August 27, 2019)
by Bill O’Grady
The Oil Market
Since June, oil prices have held within a range of $50 to $60 per barrel.
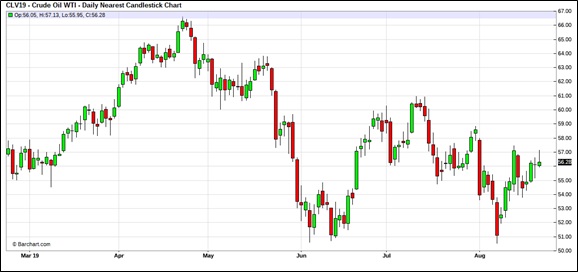
After a sharp decline in prices from late May into early June, due in part to a contra-seasonal build in inventories, inventories fell and oil prices rebounded. Rising tensions with Iran added to the lift in prices. Since then, we have seen a retest of the lower end of the range and another bounce. Unfortunately, we are heading into a weak demand period for crude oil as the summer vacation season comes to a close. Therefore, the lower support level may get tested again.
A Tale of Two Variables
Although there are several variables that affect the price of oil, within the business cycle the two we focus on are the dollar and commercial crude oil inventories. As with many situations, there are data accommodations that are necessary. Oil inventories can be problematic because, throughout history, the correlation between stockpiles and prices can flip.