by Thomas Wash | PDF
The business cycle has a major impact on financial markets; recessions usually accompany bear markets in equities. The intention of this report is to keep our readers apprised of the potential for recession, updated on a monthly basis. Although it isn’t the final word on our views about recession, it is part of our process in signaling the potential for a downturn.
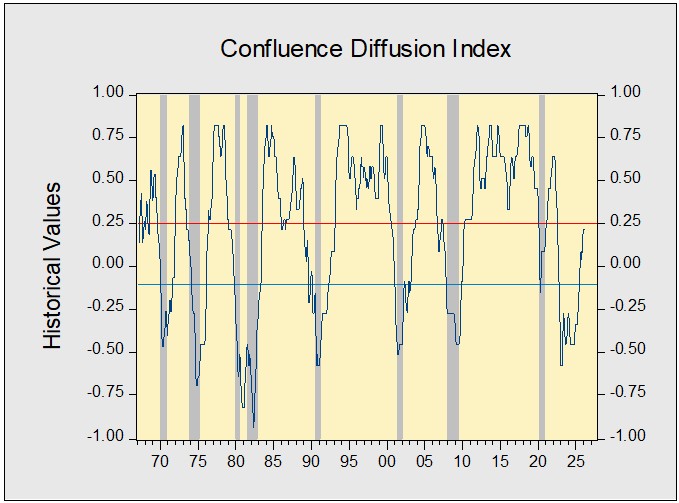
The US economy continued to expand in May, with signs that growth is holding steady. Our proprietary Confluence Diffusion Index remained in expansionary territory for the sixteenth consecutive month. That said, several areas warrant closer monitoring. Financial conditions are showing some signs of tightening, although liquidity remains ample. Firms are still investing; however, households remain concerned about rising inflation. Meanwhile, hiring continues to pick up but is still below levels consistent with a solid expansion.
Financial Markets
Bond and equity markets showed signs of cooling as investors braced for rising geopolitical tensions in the Middle East. Equities were notably volatile throughout the month, driven in part by intermittent negotiations between the United States and Iran over reopening the Strait of Hormuz. At the same time, the yield curve experienced a bearish steepening, reflecting an increased willingness by the Federal Reserve to tighten policy in response to persistent inflation. This shift was reinforced by several Fed officials advocating for the removal of language signaling an easing bias in the policy outlook.
Goods Production & Sentiment
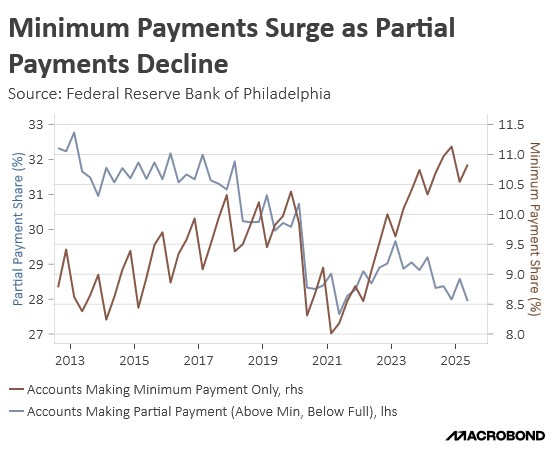
Signals from the production and sentiment side of the economy were mixed. Business investment remains resilient, supported largely by continued spending on AI infrastructure and defense. However, there are emerging signs of strain in other sectors. Housing starts declined, partly due to rising materials costs. Meanwhile, both consumer and business sentiment have softened amid concerns about the Middle East conflict and its implications for prices. This is particularly evident among households, which continue to express concerns about their current financial situation compared to a year ago, even as forward-looking expectations have modestly improved.
Labor Market
May employment data came in stronger than expected, offering renewed evidence of firm labor demand. Payroll growth significantly exceeded expectations, more than doubling consensus forecasts. Job gains were concentrated in leisure and hospitality, healthcare, and local government, with early signs of a pickup in construction employment as well. Layoffs remain subdued, with the unemployment rate holding steady and initial jobless claims declining the previous month. Overall, the data suggests that labor market momentum may be strengthening.
Outlook & Risks
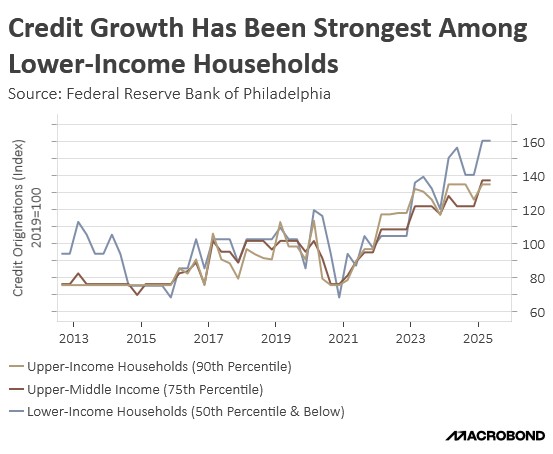
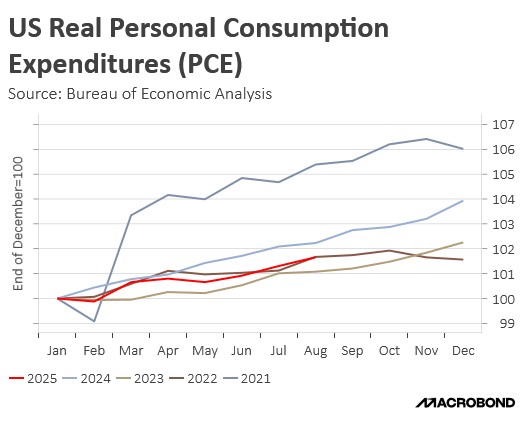
The economy appears well positioned to sustain the current expansion. Recent data indicates that the economic impact of the Iran conflict has been largely contained, with inflation being the primary transmission channel. Growth continues to be supported by robust capital expenditure in AI and ample credit availability, which has enabled households to maintain spending despite rising prices. While a potential hawkish shift by the Federal Reserve presents a risk to both markets and growth, it may be premature to draw firm conclusions about the policy path given the ongoing leadership transition at the central bank. On balance, near-term economic conditions remain constructive, and the outlook over the next 12 months has improved alongside easing geopolitical tensions.
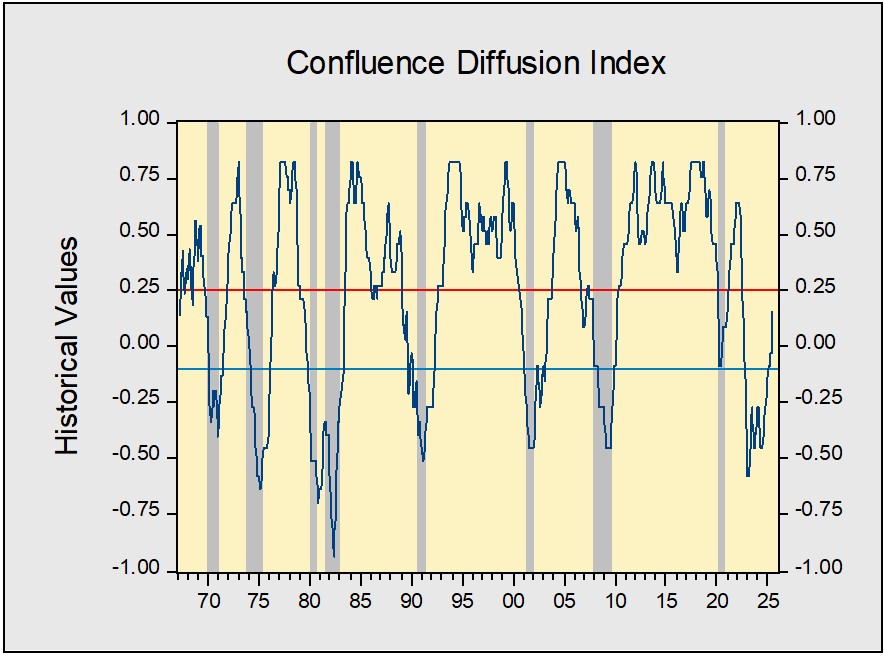
The Confluence Diffusion Index for June, which provides a composite view of the economy based on 11 benchmarks, remains in expansionary territory based on May data. The index’s value was unchanged at +0.2121, well above the recovery signal threshold of −0.1000. The index shows that the economy remains resilient in the face of geopolitical shocks. Only four of the 11 benchmarks are in contraction, up one from last month.
- Expectations of tighter monetary policy led to a flatter yield curve.
- Inflation expectations continued to weigh on consumer sentiment.
- Hiring is showing signs of gaining momentum.
The chart above shows the Confluence Diffusion Index. It uses a three-month moving average of 11 leading indicators to track the state of the business cycle. The red line signals when the business cycle is headed toward a contraction, while the blue line signals when the business cycle is in recovery. The diffusion index currently provides about six months of lead time for a contraction and five months of lead time for recovery. Continue reading for an in-depth understanding of how the indicators are performing. At the end of the report, the Glossary of Charts describes each chart and its measures. In addition, a chart title listed in red indicates that the index is signaling recession.