Tag: Treasury
Asset Allocation Bi-Weekly – Bonds and the Post-Election Environment (November 25, 2024)
by the Asset Allocation Committee | PDF
The election results are in and, contrary to expectations, voters rendered a quick and clear outcome, with Donald Trump set to return to the White House. The central case prior to the election was that the outcome would be drawn out and contentious — an outcome that would tend to support flight-to-safety assets, such as long-dated Treasurys. However, in the wake of the actual outcome, a reassessment is in order.
Our analysis of the long end of the yield curve starts with our yield model.
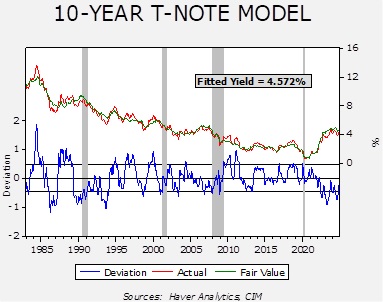
The model’s independent variables include the level of fed funds, the 15-year average of CPI yearly inflation, the five-year standard deviation of inflation, WTI oil prices, the yields on German and Japanese 10-year sovereign bonds, the yen/dollar exchange rate, the fiscal deficit scaled to GDP, and a binary variable for government control. As the model shows, yields are running below fair value but are within the expected range of outcomes.
As the election approached, despite the general consensus of a close race among the political pundits, the markets began to expect a GOP presidential win with a strong possibility of legislative control as well. In mid-September, the constant maturity 10-year T-note yield was 3.63%; it has increased to 4.45% in the wake of the election results.
A key issue is whether the yields will continue to rise in the coming weeks. Here are the factors we are watching:
- Our model’s government binary variable adds 30 bps to the fair value yield when there is a unified government. Since 1983, a situation where a single party controls both the executive and legislative branches usually results in greater spending and potentially higher deficits. We don’t apply that variable until the new legislature is seated, so we have not activated that variable quite yet. This variable will be in effect in January, though, which suggests there will be a bias toward higher yields.
- When yields peaked above 5% in late October 2023, the Treasury and the Federal Reserve acted in concert to bring yields lower. The Treasury adjusted its borrowing to the short end of the yield curve and Chair Powell signaled that the policy rate had peaked and was poised to decline. These actions sent yields lower to around 3.8% by late December 2023. Given that the current government is in “lame duck” status, we doubt that the Treasury will engage in similar behavior now. Thus, there will likely be greater tolerance for rising 10-year yields. In other words, although the Fed and the Treasury had signaled earlier that a 10-year yield above 5% was intolerable, that likely isn’t the case now.
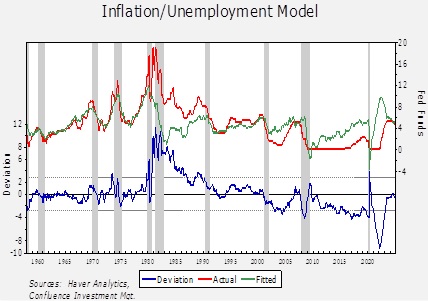
- Since the recent FOMC decision to cut 25 bps, another similar cut at the mid-December meeting is mostly expected by the markets. The unknown is what future policy will look like in the wake of recent political developments. A model based on the difference between overall yearly CPI and unemployment (an approximation of the Phillips curve) would suggest that the current policy rate is near neutral.
Anything beyond the anticipated 50 bps of cuts before year’s end will begin to move monetary policy into easing mode, which will be difficult to justify without a rapid weakening of the labor market or a drop in inflation. Without further cuts, it will be difficult for long-term yields to decline significantly.
Once President-elect Trump assembles his team at the Treasury, we could see action similar to what occurred in October 2023 to bring down long-duration Treasury yields. However, until then, there is a window where yields could rise to uncomfortable (e.g., >5%) levels. Thus, we believe investors should exercise care in extending on the yield curve into next year.
Asset Allocation Bi-Weekly – #127 “The Yield Curve Un-Inverts” (Posted 10/14/24)
Asset Allocation Bi-Weekly – The Yield Curve Un-Inverts (October 14, 2024)
by the Asset Allocation Committee | PDF
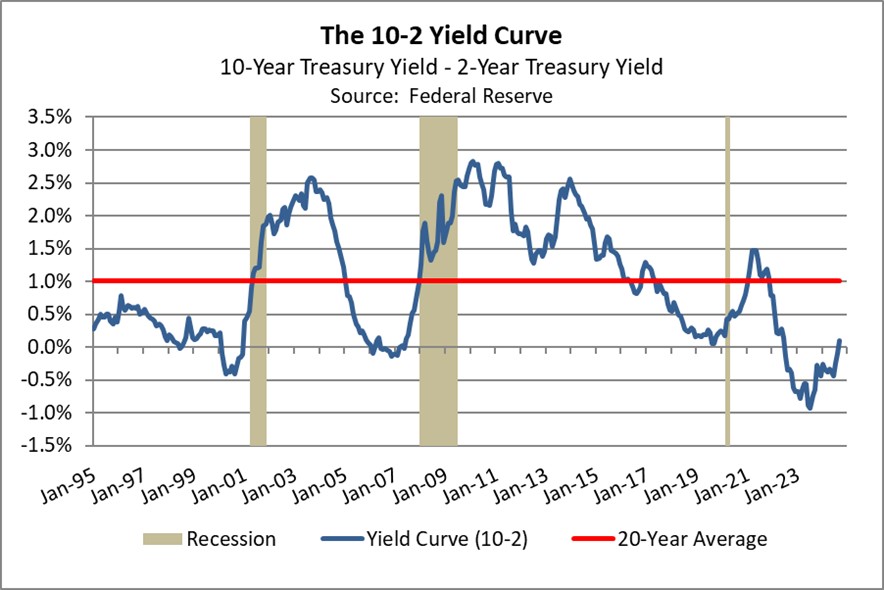
Although the financial press has failed to discuss it at length, the United States bond market has just exited a long period in which the yield curve (the range of bond yields across maturities) was inverted (longer-term yields were lower than shorter-term yields). One popular summary measure of the yield curve is the difference between the 10-year Treasury note’s yield and the yield on the two-year Treasury note. By that measure, based on month-end figures, the yield curve was inverted for 25 straight months from July 2022 through August 2024. At its nadir of -0.93% in July 2023, the 10-year Treasury yield was 3.90% and the two-year Treasury yield was 4.83%. At the end of September 2024, this measure of the yield curve had turned positive at 0.10%, with the 10-year Treasury yield falling 18 basis points to 3.72% and the two-year Treasury yield falling 121 basis points to 3.62% (see table below). Positive, upward-sloping yield curves are considered more normal.
The yield curve is closely tracked because inversions have often signaled an impending recession and falling values for risk assets. At this point, it appears that the latest inversion was a false signal of recession. It does appear that US economic growth has slowed, but there are only limited signs currently that the economy could be heading into a broad decline. Investment strategists have nevertheless begun to focus on the implications of the yield curve turning positive again. Many are urging investors to rotate into longer-maturity bonds, apparently on the conviction that longer-maturity bonds will see big price gains (implying big yield declines), while shorter-maturity bonds will see smaller price gains (implying smaller yield declines). Is this reasonable?
To get at that question, we analyzed the total return (yield plus price change) for both five-year and 10-year Treasury notes after each of the eight un-inversions of the yield curve since the early 1960s. We focused on the total return for Treasury notes at three months, six months, and 12 months after the end of each inversion. The results of our analysis are shown in the table below.
The table shows that in the 12 months after the un-inversions since the 1960s, the average total returns on five-year and 10-year Treasury notes have been positive but not spectacular. The table suggests that the key variable is what happens with the Federal Reserve’s benchmark fed funds interest rate in the year after the un-inversion. To the extent that the fed funds rate declines in the year after un-inversion, total returns for longer-maturity Treasury obligations are greater. If the fed funds rate is basically stable in the year after un-inversion, investors’ total returns from longer-maturity Treasurys have been similar to the yield on those obligations. But if the fed funds rate increases in the year after un-inversion, the total returns on longer-maturity Treasurys have typically been negative.
Looking out at the coming year, investors widely expect the Fed to keep cutting the fed funds rate, so today’s ubiquitous calls for longer-maturity Treasurys may make some sense. However, investors should also not forget the burgeoning bond issuance that could potentially outpace demand. In our view, in addition to lower policy rates, the Fed may need to end its balance sheet reduction program to help alleviate some of the liquidity concerns in the bond market. Policymakers could also decide to cut rates gradually over the coming year and only moderate the pace of balance sheet reduction. That’s especially so after the strong September employment report, which pointed toward rebounding demand for labor and increased wage pressures. More broadly, modest policy easing would be expected if US economic growth remains healthy and/or consumer price inflation doesn’t cool as much as anticipated. Based on the analysis presented here, the resulting “restrictive for longer” approach to monetary policy would likely limit the total returns for longer-dated Treasurys. An economic soft landing and modest monetary easing mean the maturity extension trade probably doesn’t work.
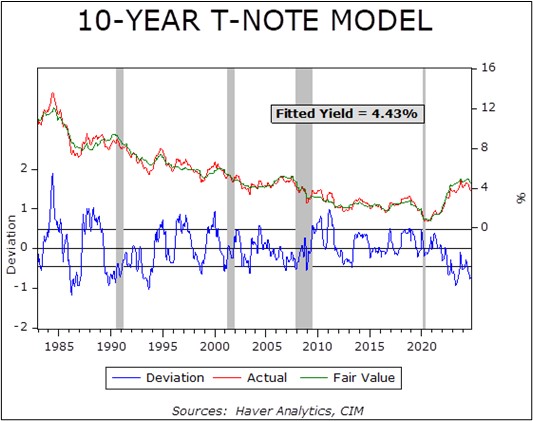
We also note that in the year after an un-inversion, the average total return on five-year Treasury notes is better than the total return on 10-year Treasurys, especially in cases where the fed funds rate increases. We see a similar implication from our bond model, which we use to predict fair value bond yields based on key economic indicators. When we plug a 3.25% fed funds rate into the model (roughly the level policymakers expect to reach by year-end 2025), we get a projected decline in the five-year Treasury yield from current levels but a rise to nearly 4.00% for the 10-year yield. (At today’s fed funds rate of 4.75% to 5.00%, the model estimates a fair value of 4.43% for the 10-year Treasury, as shown in the chart below.)
In sum, rotating into longer-maturity bonds to generate greater returns may not make sense right now, even if some observers are calling for it. Further normalization of the yield curve may indeed be in store as the Fed keeps cutting short-term interest rates, but those rate cuts may well prove modest if the US economy keeps growing. That could limit any price gains and total return opportunities in longer-dated fixed income. If the economy avoids a recession and reaccelerates, pushing up inflation again and potentially requiring renewed rate hikes, longer-maturity obligations could produce negative total returns. Keeping most bond exposure relatively short still seems to make sense today, even as it might be prudent to maintain some longer-maturity exposure to hedge against geopolitical risks.
Asset Allocation Bi-Weekly – #124 “Activist vs. Accommodative Treasury Issuance” (Posted 8/26/24)
Asset Allocation Bi-Weekly – Activist vs. Accommodative Treasury Issuance (August 26, 2024)
by the Asset Allocation Committee | PDF
The Federal Reserve and the US Treasury are independent government agencies with the shared objective of economic prosperity. While the Treasury manages government finances and executes fiscal policy, the Fed focuses on monetary policy as it aims to maintain price stability and full employment. Despite the Fed and the Treasury having distinct roles, there is an ongoing debate over whether they should coordinate their policies or whether it’s appropriate for one to work at cross-purposes with the other, particularly in the context of the big US budget deficit and growing debt load.
A recent report has accused the Treasury of intentionally shifting its debt issuance strategy to favor shorter-term bills over longer-term notes to the detriment of the country. Economists Nouriel Roubini and Stephen Miran, both Treasury veterans, contend in their paper, “ATI: Activist Treasury Issuance and the Tug-of-War Over Monetary Policy,” that this strategy is a deliberate attempt to counteract the Fed’s tightening measures and artificially stimulate the economy.
The Roubini and Miran paper argues that the Treasury’s strategy effectively amounts to a covert form of quantitative easing (QE). When the Fed employs QE to stimulate the economy, it purchases long-term bonds, thereby suppressing interest rates. The Treasury can achieve a similar outcome by shifting toward shorter-term debt issuance. By reducing the supply of longer-term bonds, the Treasury can indirectly push up their prices and lower their yields, effectively loosening financial conditions.
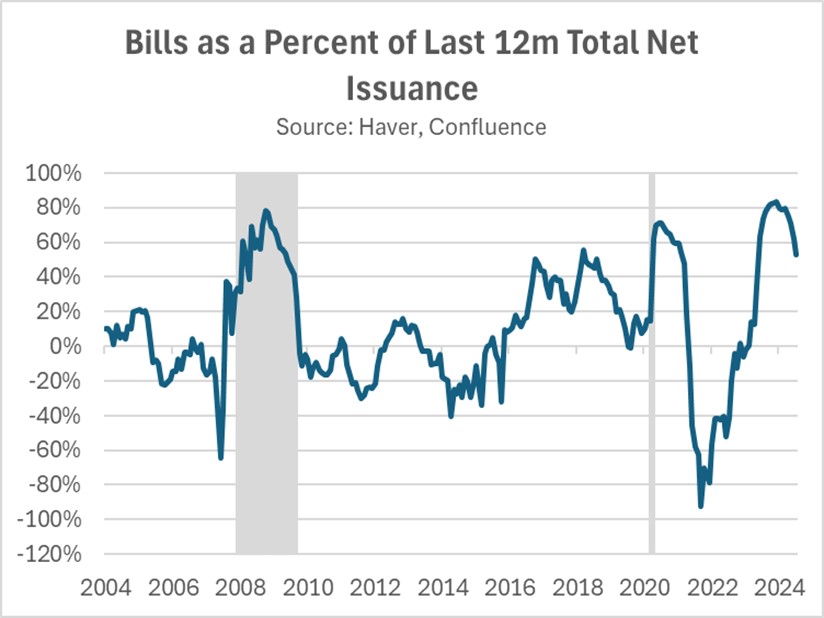
Roubini and Miran contend that the Treasury’s shift toward more bill issuance has counteracted the Fed’s effort to tighten monetary policy, contributing to the robust economic growth and elevated inflation seen in Q1 2024. According to Roubini and Miran, Treasury bills serve as a near-cash asset, enabling financial institutions, institutional investors, and corporations to secure loans by using them as collateral. In essence, the issuance of new Treasury bills can amplify the money supply through the money multiplier effect, which increases market liquidity.
While they acknowledge the typical shift toward shorter-term Treasury issuance in economic downturns, Roubini and Miran argue that the current pronounced bias for bills over notes is exceptional and may be politically motivated. By prioritizing bill issuance, the Treasury may have sought to avert a surge in long-term interest rates typically associated with bond sales. This strategy is credited with contributing to a decline in 10-year yields, which, in turn, has fueled risk appetites and inflated stock valuations in the lead-up to the election.
However, an alternative explanation for the Treasury’s issuance reallocation lies in the market’s response to rising interest rates. When the Fed initiated rate hikes in 2022, demand for longer-term bonds weakened due to increased interest rate risk. Conversely, demand for shorter-term Treasury bills surged, primarily driven by money market funds and institutional investors seeking higher yields on short-term assets. This market dynamic is reflected in the results of Treasury auctions, with 10-year bonds consistently undersubscribed and two-year bills frequently oversubscribed.
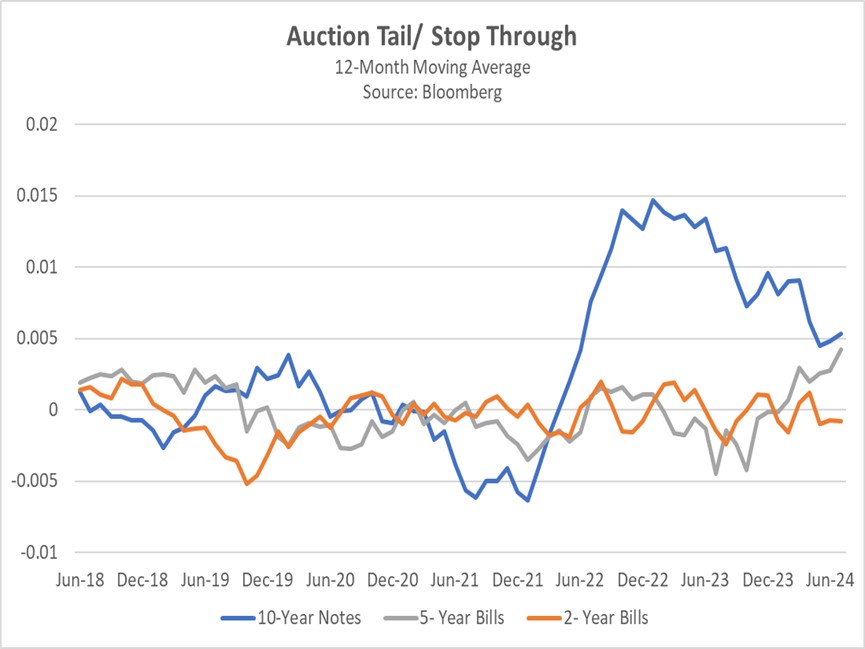
Moreover, the Treasury’s issuance strategy may not be as counterproductive as Roubini and Miran imply, since the sale of bills has mitigated the need for extraordinary Fed intervention in the economy. Prior to the change, the banking sector faced severe liquidity challenges following the collapse of Silicon Valley Bank in 2023 due to heavy investments in low-yielding, long-duration bonds. As interest rates rose, bond values fell and hindered banks’ ability to use them as collateral to meet short-term cash needs. In response, the Fed established new lending facilities, which helped address the immediate crisis but hampered its balance sheet reduction efforts.
By significantly increasing bill issuance, the Treasury provided the banking system with high-quality collateral, therefore mitigating the risk of a liquidity crunch within the repo market. This buffer has made it easier for the Fed to maintain its policy tightening without hurting the financial system. As interest rates begin to decline, the urgency of this allocation strategy will lessen, leading to a gradual reduction in Treasury bill issuance as a share of total issuance.
Contrary to Roubini and Miran’s assertion, the Treasury’s allocation strategy has actually seemed to support the Fed’s objectives. It has enabled the Fed to prolong quantitative tightening and maintain higher interest rates for an extended period and has increased the likelihood of a soft landing. However, this cooperative stance could potentially embolden the Fed to adopt a more gradual easing path, which would benefit short to intermediate bond yields.


